통계적 편차를 기반으로 한 시장 극심한 하락 전략

1
Follow
1781
Followers
개요
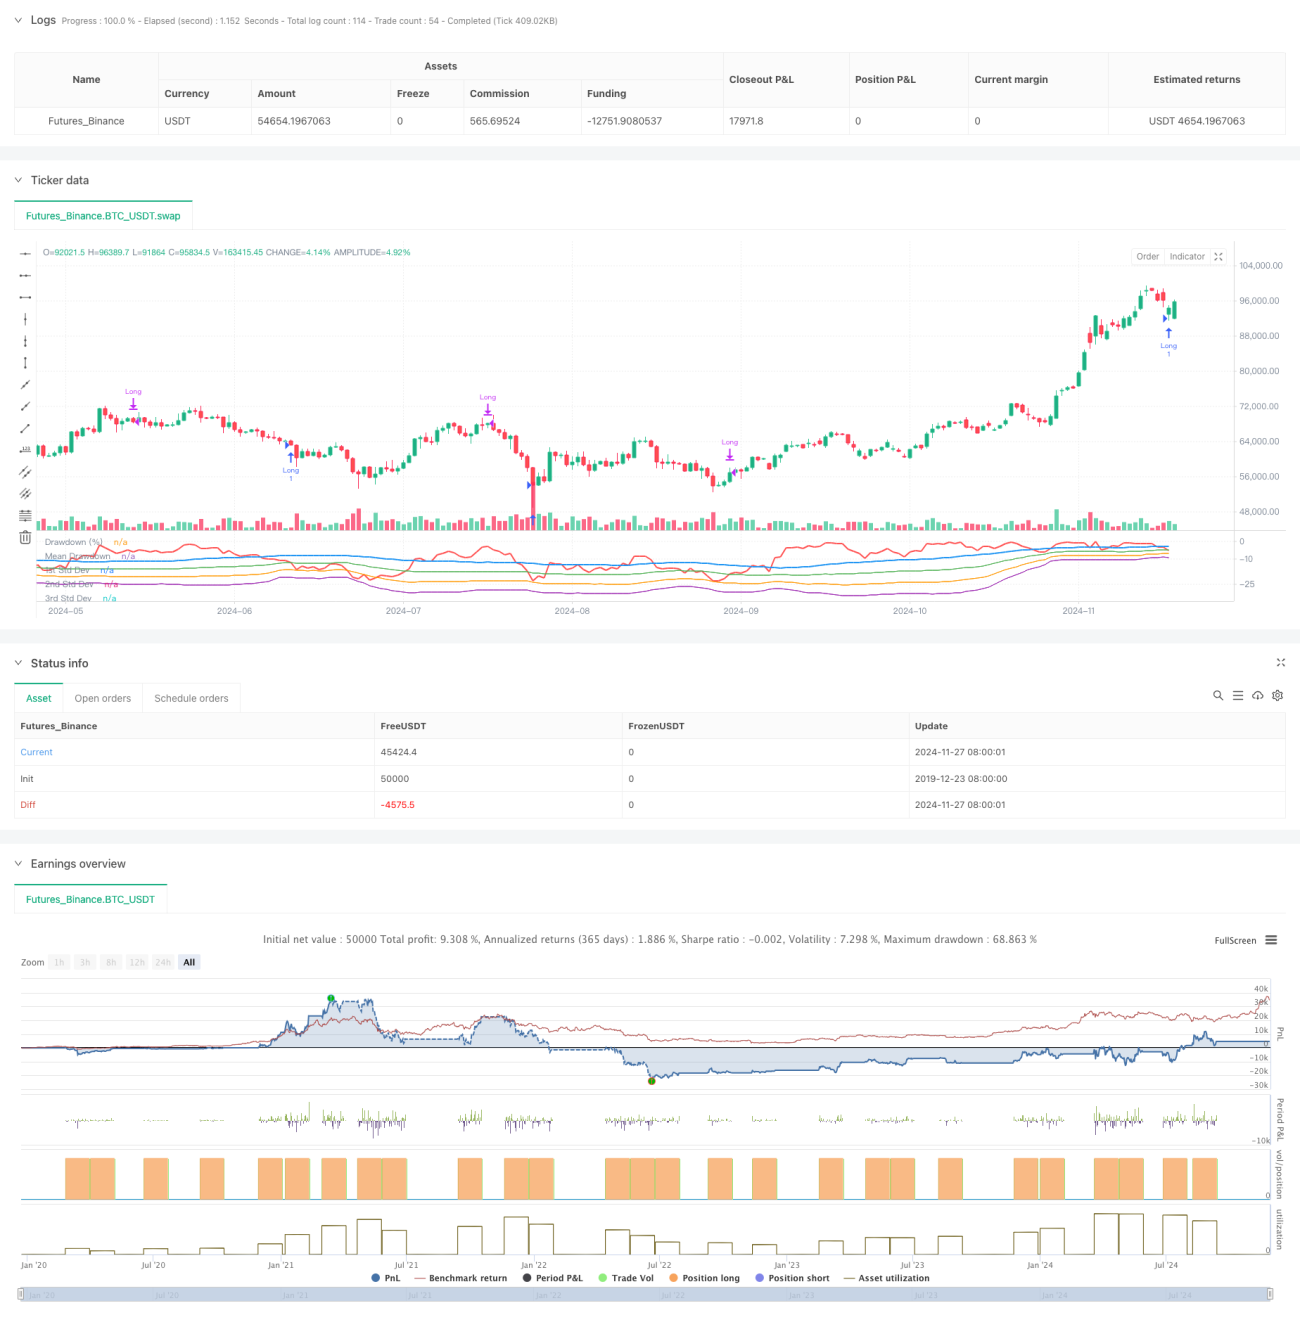
이 전략은 시장이 극도로 하락할 때 통계적 특성을 기반으로 거래한다. 철회에 대한 통계적 분석을 통해 표준 차이를 사용하여 시장의 변동의 극도를 측정하고, 시장이 정상적인 범위를 초과하는 하락이 발생할 때 구매한다. 전략의 핵심 아이디어는 시장의 공포 감정으로 인한 초하락 기회를 포착하고, 수학적인 통계적 방법을 통해 시장의 비합리적인 행동으로 인한 투자 기회를 식별하는 것이다.
전략 원칙
이 전략은 가격의 최대 회수와 회수 수치를 계산하는 점수를 Rolling Time Window로 사용합니다. 우선 지난 50주기의 최고 가격을 계산하고, 그 다음에는 현재 폐장 가격에 대한 최고 가격의 회수 비율을 계산합니다. 그 다음에는 회수의 평균값과 표준 차이를 계산하고, 트리거 마이너스로 표준 차이의 1배를 설정합니다. 시장의 회수가 평균값을 초과하면 표준 차이는 설정된 배수를 제거하여 시장이 초과할 수 있음을 나타냅니다.
전략적 이점
- 전략은 통계학 원리에 기초하고, 견고한 이론적 기반을 가지고 있다. 표준차를 통해 시장 변동의 극단적 정도를 측정하는 방법 객관적인 과학이다.
- 이 전략은 시장의 공포 시기의 투자 기회를 효과적으로 포착할 수 있다. 시장이 비합리적으로 하락할 때 출입하는 것은 가치 투자의 철학에 부합한다.
- 고정 주기 평준화 방식을 채택하여, 스톱로드를 추적하여 반발을 놓칠 수 있는 문제를 피할 수 있다.
- 전략의 매개 변수는 조정 가능하며, 다른 시장 환경과 거래 품종 특성에 따라 유연하게 설정할 수 있다.
- 회수 및 표준편차 지표의 계산은 간단하고, 전략 논리는 명확하고, 이해하기 쉽고 실행하기 쉽다.
전략적 위험
- 시장의 지속적인 하락으로 인해 전략이 자주 상장하지만 손실이 발생할 수 있습니다. 최대 보유 수에 대한 제한을 설정하는 것이 좋습니다.
- 고정 주기 평소 포지션은 더 큰 상승 공간을 놓칠 수 있다. 추세를 추적하는 평소 포지션을 추가하는 방법을 고려할 수 있다.
- 철회 통계적 특성은 시장 환경 변화에 따라 변경될 수 있습니다. 매개 변수 설정을 정기적으로 업데이트하는 것이 좋습니다.
- 전략은 거래량과 같은 다른 시장 정보를 고려하지 않습니다. 여러 지표와 결합하여 상호 검증하는 것이 좋습니다.
- 급격한 변동성 시장 환경에서는 표준 차이는 부정확할 수 있다. 위험 제어 조치를 설정하는 것이 좋습니다.
전략 최적화 방향
- 시장의 공포를 확인하기 위해 거래량 지표를 도입했습니다.
- 트렌드 지표를 늘리고, 하향 트렌드에서 자주 입주를 피하십시오.
- 평점 메커니즘을 최적화하고, 시장의 성과에 따라 포지션 보유 시간을 조정한다.
- 단편 거래 위험을 통제하기 위한 스톱로스 설정을 늘립니다.
- 시장 변화에 대한 전략의 적응성을 높이기 위해 적응성 파라미터를 사용하는 것을 고려하십시오.
요약하다
이 전략은 통계학적인 방법을 통해 시장의 오버박스 기회를 포착하고, 좋은 이론적 기초와 실용적 가치를 갖는다. 전략 논리는 간단하고 명확하며, 매개 변수는 조정성이 강하며, 기본 전략으로 확장 및 최적화를 위해 적합하다. 다른 기술 지표와 위험 제어 조치를 추가함으로써 전략의 안정성과 수익성을 더욱 향상시킬 수 있다. 실장 거래에서는 시장 환경과 거래 품종의 특성을 결합하여 신중하게 매개 변수를 설정하고, 위험을 잘 제어하는 것이 좋습니다.
Source
Pine
Strategy parameters
Related strategies
Comment
All comments (0)
No data
- 1