동적 신호선 추세 추종 및 변동성 필터링 전략

DSL ATR RSI ZLEMA SMA EMA
생성 날짜: 2024-11-29 17:02:33 마지막으로 수정됨: 2024-11-29 17:02:33
복사: 2 클릭수: 502
avatar of ChaoZhang ChaoZhang
1
집중하다
1617
수행원

동적 신호선 추세 추종 및 변동성 필터링 전략

개요

이 전략은 동적 신호 라인 ((DSL), 변동률 및 동적 지표를 결합한 통합 거래 시스템이다. 이 전략은 동적 하락과 자기 적응하는 변동 대역 방식을 통해 시장 추세를 효과적으로 식별하고 동적 지표를 사용하여 신호 필터링을 수행하여 정확한 거래 시기를 파악한다. 시스템은 동적 스톱 손실과 위험 기반의 수익률 목표를 설정하는 것을 포함한 완전한 위험 관리 장치를 설계했다.
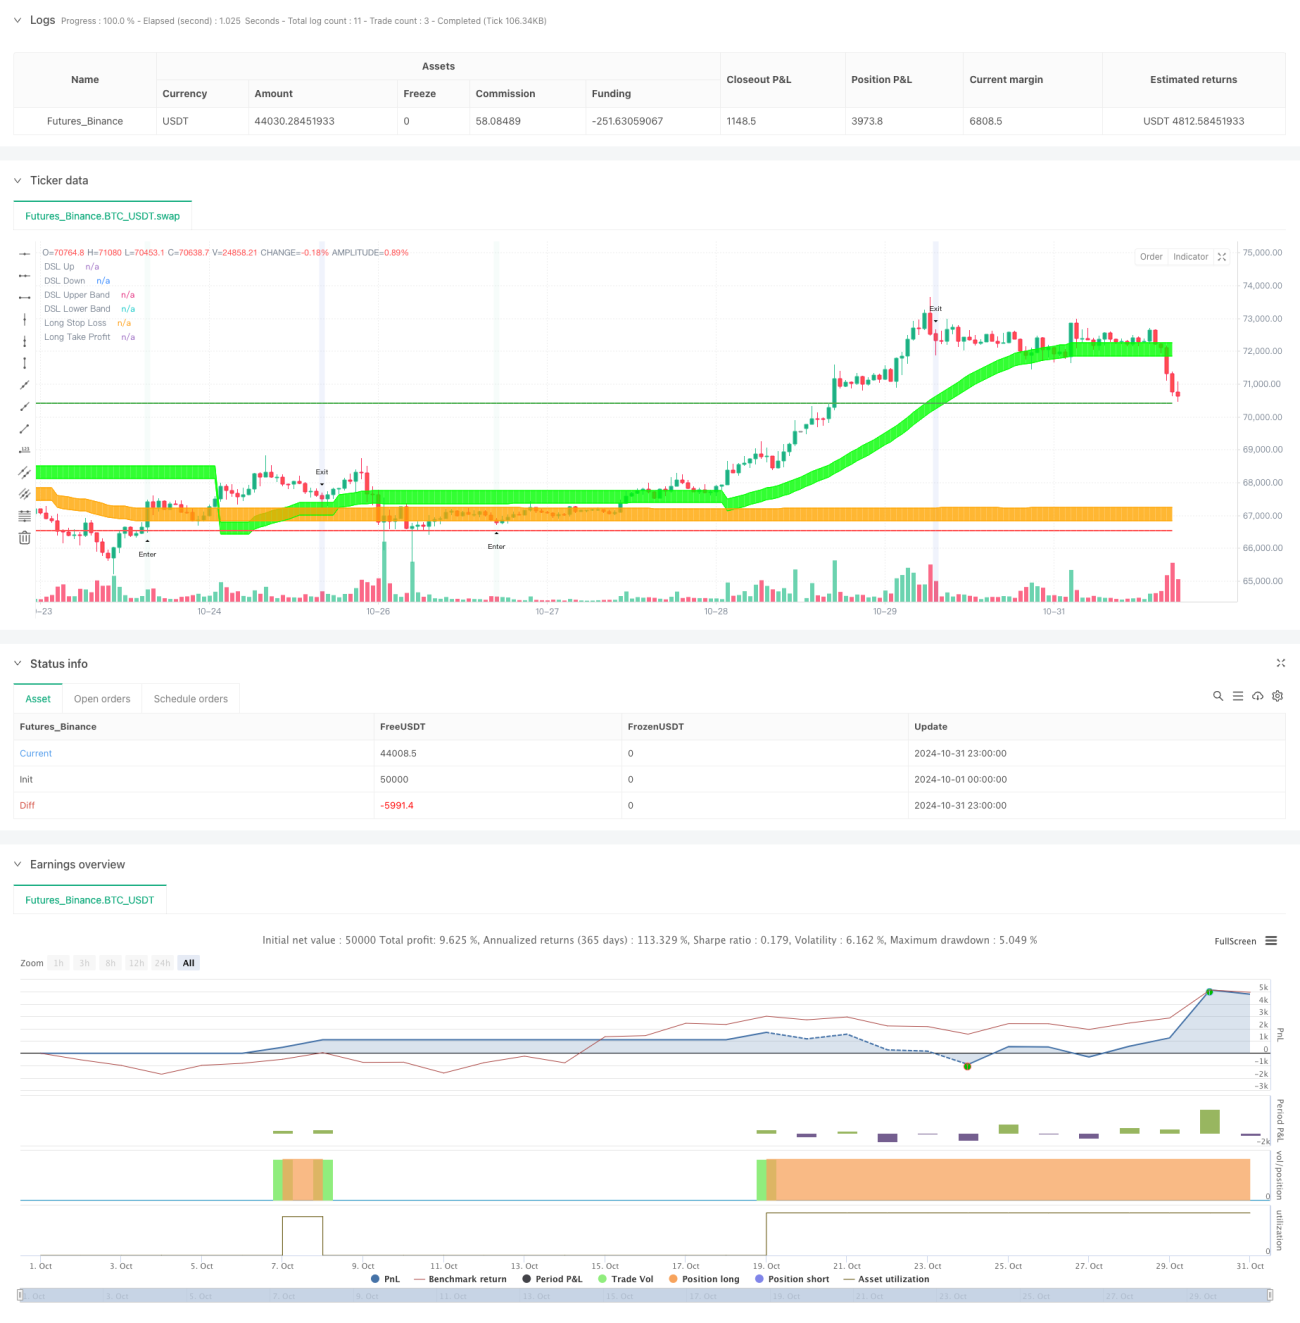
전략 원칙

이 전략의 핵심 논리는 다음과 같은 세 가지 주요 구성 요소에 기반합니다.

먼저 동적 신호 라인 시스템으로, 이동 평균에 기반한 동적 상하 궤도 라인을 계산한다. 이러한 궤도 라인은 시장의 최근의 고점과 낮은 점에 따라 자동으로 위치를 조정하고, 트렌드에 대한 자율적 추적을 구현한다. 시스템은 또한 ATR 지표와 결합하여 트렌드 강도를 확인하고 스톱 포지션을 설정하기 위해 동적 파동 대역을 구성한다.

다음으로 동력 분석 시스템으로 0 지연 지수 이동 평균 (ZLEMA) 을 통해 최적화된 RSI 지표를 사용합니다. RSI에 동적 신호 라인 개념을 적용함으로써, 시스템은 오버 바이 오버 셀 영역을 더 정확하게 식별하고 동력 돌파 신호를 생성 할 수 있습니다.

세 번째는 신호 통합 메커니즘이다. 거래 신호는 트렌드 확인과 동력 돌파의 두 가지 조건을 동시에 충족시켜야 한다. 다중 입장은 가격이 궤도를 돌파하고 궤도 위쪽에 유지되는 것을 요구하며, RSI는 아래의 동적 신호 라인을 돌파한다. 공중 신호는 반대 조건이 동시에 충족되어야 한다.

전략적 이점

  1. 자기 적응력: 동적 신호선과 변동폭은 시장 상황에 따라 자동으로 조정되어 전략이 다른 시장 환경에 적응할 수 있습니다.
  2. 가짜 신호 필터링: 트렌드 및 동력의 이중 확인을 요구함으로써 가짜 신호의 가능성을 크게 감소시킵니다.
  3. 리스크 관리: ATR 기반의 동적 중지 손실과 리스크 수익률 기반의 수익 목표 설정이 통합되어 체계화된 리스크 통제가 구현되었습니다.
  4. 유연한 사용자 정의: 전략 매개 변수는 다른 시장과 시간 주기에 따라 최적화 조정할 수 있습니다.

전략적 위험

  1. 트렌드 역전 위험: 급격한 시장 역전시 동적 신호 선의 조정이 적당하게 조정이 되지 않을 수 있으며, 더 큰 회수로 이어질 수 있다.
  2. 진동 시장 위험: 지역 진동 시장에서, 빈번한 돌파는 여러 번의 중단으로 이어질 수 있다.
  3. 매개 변수 민감성: 정책의 성능은 매개 변수 설정에 민감하며, 잘못된 매개 변수는 정책의 효과를 영향을 줄 수 있다.

전략 최적화 방향

  1. 시장 환경 식별: 시장 환경 분류 메커니즘을 추가하여 다른 시장 상태에서 다른 파라미터 설정을 사용할 수 있습니다.
  2. 동적 변수 최적화: 시장의 변동성에 따라 신호선 및 변동 대역 변수를 자동으로 최적화하는 적응 변수 조정 메커니즘을 도입한다.
  3. 다중 시간 주기의 분석: 여러 시간 주기의 신호를 통합하여 거래 의사 결정의 신뢰성을 높인다.
  4. 변동률 적응: 높은 변동률 동안 중지 손실과 위험 수익률을 조정하고, 전략의 위험 조정 후 수익률을 향상시킵니다.

요약하다

이 전략은 동적 신호선과 동적 지표의 혁신적인 조합을 통해 시장 추세를 효과적으로 포착합니다. 완벽한 위험 관리 메커니즘과 신호 필터링 시스템은 강력한 실전 응용 가치를 갖습니다. 지속적인 최적화 및 매개 변수 조정으로 전략은 다양한 시장 환경에서 안정적인 성능을 유지할 것으로 예상됩니다.

전략 소스 코드
/*backtest
start: 2024-10-01 00:00:00
end: 2024-10-31 23:59:59
period: 1h
basePeriod: 1h
exchanges: [{"eid":"Futures_Binance","currency":"BTC_USDT"}]
*/

// This Pine Script™ code is subject to the terms of the Mozilla Public License 2.0 at https://mozilla.org/MPL/2.0/
// © DailyPanda

//@version=5
strategy("DSL Strategy [DailyPanda]",
     initial_capital = 2000,
     commission_value=0.00,
     slippage=3,
     overlay = true)

//--------------------------------------------------------------------------------------------------------------------
// USER INPUTS
//--------------------------------------------------------------------------------------------------------------------

// DSL Indicator Inputs CP
int   len         = input.int(34, "Length", group="CP")      // Length for calculating DSL
int   offset      = input.int(30, "Offset", group="CP")      // Offset for threshold levels
float width       = input.float(1, "Bands Width", step = 0.1, maxval = 2, minval = 0.5, group="CP") // Width for ATR-based bands
float risk_reward = input.float(1.5, "Risk Reward", group="Risk Mgmt") // Risk Reward ratio

// Colors for upper and lower trends
color upper_col = input.color(color.lime, "+", inline = "col")
color lower_col = input.color(color.orange, "-", inline = "col")

// DSL-BELUGA
len_beluga  = input.int(10, "Beluga Length", group="BELUGA")
dsl_mode_inp = input.string("Fast", "DSL Lines Mode", options=["Fast", "Slow"], group="BELUGA")
dsl_mode    = dsl_mode_inp == "Fast" ? 2 : 1

// Colors for DSL-BELUGA
color color_up = #8BD8BD
color color_dn = #436cd3

i_lossPct = input.int(defval=100, title="% max day DD", minval=1, maxval=100, step=1, group="Risk Management")
i_goal = input.bool(title="Enable Daily Goal", defval=false, group="Risk Management")
i_goalPct = input.int(defval=4, title="% Daily Goal", minval=1, step=1, group="Risk Management")


//############################## RISK MANAGEMENT ##############################
// Set maximum intraday loss to our lossPct input
// strategy.risk.max_intraday_loss(i_lossPct, strategy.percent_of_equity)
//strategy.risk.max_intraday_loss(value=1200, type=strategy.cash)

// Store equity value from the beginning of the day
eqFromDayStart = ta.valuewhen(ta.change(dayofweek) > 0, strategy.equity, 0)
// Calculate change of the current equity from the beginning of the current day
eqChgPct = 100 * ((strategy.equity - eqFromDayStart - strategy.openprofit) / (strategy.equity-strategy.openprofit))
f_stopGain = eqChgPct >= i_goalPct and i_goal ? true : false


//--------------------------------------------------------------------------------------------------------------------
// INDICATOR CALCULATIONS
//--------------------------------------------------------------------------------------------------------------------

// Function to calculate DSL lines based on price
dsl_price(float price, int len) =>
    // Initialize DSL lines
    float dsl_up = na
    float dsl_dn = na
    float sma    = ta.sma(price, len)

    // Dynamic upper and lower thresholds calculated with offset
    float threshold_up = ta.highest(len)[offset] 
    float threshold_dn = ta.lowest(len)[offset] 

    // Calculate the DSL upper and lower lines based on price compared to the thresholds
    dsl_up := price > threshold_up ? sma : nz(dsl_up[1]) 
    dsl_dn := price < threshold_dn ? sma : nz(dsl_dn[1])

    // Return both DSL lines
    [dsl_up, dsl_dn]

// Function to calculate DSL bands based on ATR and width multiplier
dsl_bands(float dsl_up, float dsl_dn) =>
    float atr = ta.atr(200) * width // ATR-based calculation for bands
    float upper = dsl_up - atr       // Upper DSL band
    float lower = dsl_dn + atr       // Lower DSL band

    [upper, lower]

// Get DSL values based on the closing price
[dsl_up, dsl_dn] = dsl_price(close, len)

// Calculate the bands around the DSL lines
[dsl_up1, dsl_dn1] = dsl_bands(dsl_up, dsl_dn)


//--------------------------------------------------------------------------------------------------------------------
// DSL-BELUGA INDICATOR CALCULATIONS
//--------------------------------------------------------------------------------------------------------------------

// Calculate RSI with a period of 10
float RSI = ta.rsi(close, 10)

// Zero-Lag Exponential Moving Average function
zlema(src, length) =>
    int   lag      = math.floor((length - 1) / 2)
    float ema_data = 2 * src - src[lag]
    float ema2     = ta.ema(ema_data, length)
    ema2

// Discontinued Signal Lines function
dsl_lines(src, length)=>
    float up  = 0.
    float dn  = 0.
    up := (src > ta.sma(src, length)) ? nz(up[1]) + dsl_mode / length * (src - nz(up[1])) : nz(up[1])  
    dn := (src < ta.sma(src, length)) ? nz(dn[1]) + dsl_mode / length * (src - nz(dn[1])) : nz(dn[1])
    [up, dn]

// Calculate DSL lines for RSI
[lvlu, lvld] = dsl_lines(RSI, len_beluga)

// Calculate DSL oscillator using ZLEMA of the average of upper and lower DSL Lines
float dsl_osc = zlema((lvlu + lvld) / 2, 10)

// Calculate DSL Lines for the oscillator
[level_up, level_dn] = dsl_lines(dsl_osc, 10)

// Detect crossovers for signal generation
bool up_signal = ta.crossover(dsl_osc, level_dn) and dsl_osc < 55
bool dn_signal = ta.crossunder(dsl_osc, level_up) and dsl_osc > 50

//--------------------------------------------------------------------------------------------------------------------
// VISUALIZATION
//--------------------------------------------------------------------------------------------------------------------

// Plot the DSL lines on the chart
plot_dsl_up = plot(dsl_up, color=color.new(upper_col, 80), linewidth=1, title="DSL Up")
plot_dsl_dn = plot(dsl_dn, color=color.new(lower_col, 80), linewidth=1, title="DSL Down")

// Plot the DSL bands
plot_dsl_up1 = plot(dsl_up1, color=color.new(upper_col, 80), linewidth=1, title="DSL Upper Band")
plot_dsl_dn1 = plot(dsl_dn1, color=color.new(lower_col, 80), linewidth=1, title="DSL Lower Band")

// Fill the space between the DSL lines and bands with color
fill(plot_dsl_up, plot_dsl_up1, color=color.new(upper_col, 80))
fill(plot_dsl_dn, plot_dsl_dn1, color=color.new(lower_col, 80))

// Plot signals on the chart
plotshape(up_signal, title="Buy Signal", style=shape.triangleup, location=location.belowbar, size=size.tiny, text="Enter")
plotshape(dn_signal, title="Sell Signal", style=shape.triangledown, location=location.abovebar, size=size.tiny, text="Exit")

// Color the background on signal occurrences
bgcolor(up_signal ? color.new(color_up, 90) : na, title="Up Signal Background", editable = false)
bgcolor(dn_signal ? color.new(color_dn, 90) : na, title="Down Signal Background", editable = false)

//--------------------------------------------------------------------------------------------------------------------
// STRATEGY CONDITIONS AND EXECUTION
//--------------------------------------------------------------------------------------------------------------------

// Variables to hold stop loss and take profit prices
var float long_stop_loss_price  = na
var float long_take_profit_price = na
var float short_stop_loss_price = na
var float short_take_profit_price = na
float pos_size = math.abs(strategy.position_size)

// Long Entry Conditions
bool long_condition1 = not na(dsl_up1) and not na(dsl_dn) and dsl_up1 > dsl_dn
bool long_condition2 = open > dsl_up and close > dsl_up and open[1] > dsl_up and close[1] > dsl_up and open[2] > dsl_up and close[2] > dsl_up
bool long_condition3 = up_signal and pos_size == 0
bool long_condition  = long_condition1 and long_condition2 and long_condition3 and (not f_stopGain)

// Short Entry Conditions
bool short_condition1 = not na(dsl_dn1) and not na(dsl_up) and dsl_dn < dsl_up1
bool short_condition2 = open < dsl_dn1 and close < dsl_dn1 and open[1] < dsl_dn1 and close[1] < dsl_dn1 and open[2] < dsl_dn1 and close[2] < dsl_dn1
bool short_condition3 = dn_signal and pos_size == 0
bool short_condition  = short_condition1 and short_condition2 and short_condition3 and (not f_stopGain)

// Long Trade Execution
if (long_condition and not na(dsl_up1))
    long_stop_loss_price := dsl_up1
    float risk = close - long_stop_loss_price
    if (risk > 0)
        long_take_profit_price := close + risk * risk_reward
        strategy.entry("Long", strategy.long)
        strategy.exit("Exit Long", from_entry="Long", stop=long_stop_loss_price, limit=long_take_profit_price)
else if (strategy.position_size <= 0)
    // Reset when not in a long position
    long_stop_loss_price  := na
    long_take_profit_price := na

// Short Trade Execution
if (short_condition and not na(dsl_dn1))
    short_stop_loss_price := dsl_dn1
    float risk = short_stop_loss_price - close
    if (risk > 0)
        short_take_profit_price := close - risk * risk_reward
        strategy.entry("Short", strategy.short)
        strategy.exit("Exit Short", from_entry="Short", stop=short_stop_loss_price, limit=short_take_profit_price)
else if (strategy.position_size >= 0)
    // Reset when not in a short position
    short_stop_loss_price := na
    short_take_profit_price := na

//--------------------------------------------------------------------------------------------------------------------
// PLOTTING STOP LOSS AND TAKE PROFIT LEVELS
//--------------------------------------------------------------------------------------------------------------------

// Plot the stop loss and take profit levels only when in a position
float plot_long_stop_loss   = strategy.position_size > 0 ? long_stop_loss_price : na
float plot_long_take_profit = strategy.position_size > 0 ? long_take_profit_price : na

float plot_short_stop_loss   = strategy.position_size < 0 ? short_stop_loss_price : na
float plot_short_take_profit = strategy.position_size < 0 ? short_take_profit_price : na

plot(plot_long_stop_loss, title="Long Stop Loss", color=color.red, linewidth=2, style=plot.style_linebr, editable=false)
plot(plot_long_take_profit, title="Long Take Profit", color=color.green, linewidth=2, style=plot.style_linebr, editable=false)

plot(plot_short_stop_loss, title="Short Stop Loss", color=color.red, linewidth=2, style=plot.style_linebr, editable=false)
plot(plot_short_take_profit, title="Short Take Profit", color=color.green, linewidth=2, style=plot.style_linebr, editable=false)