MACD-RSI 동적 크로스오버 양적 거래 시스템

개요
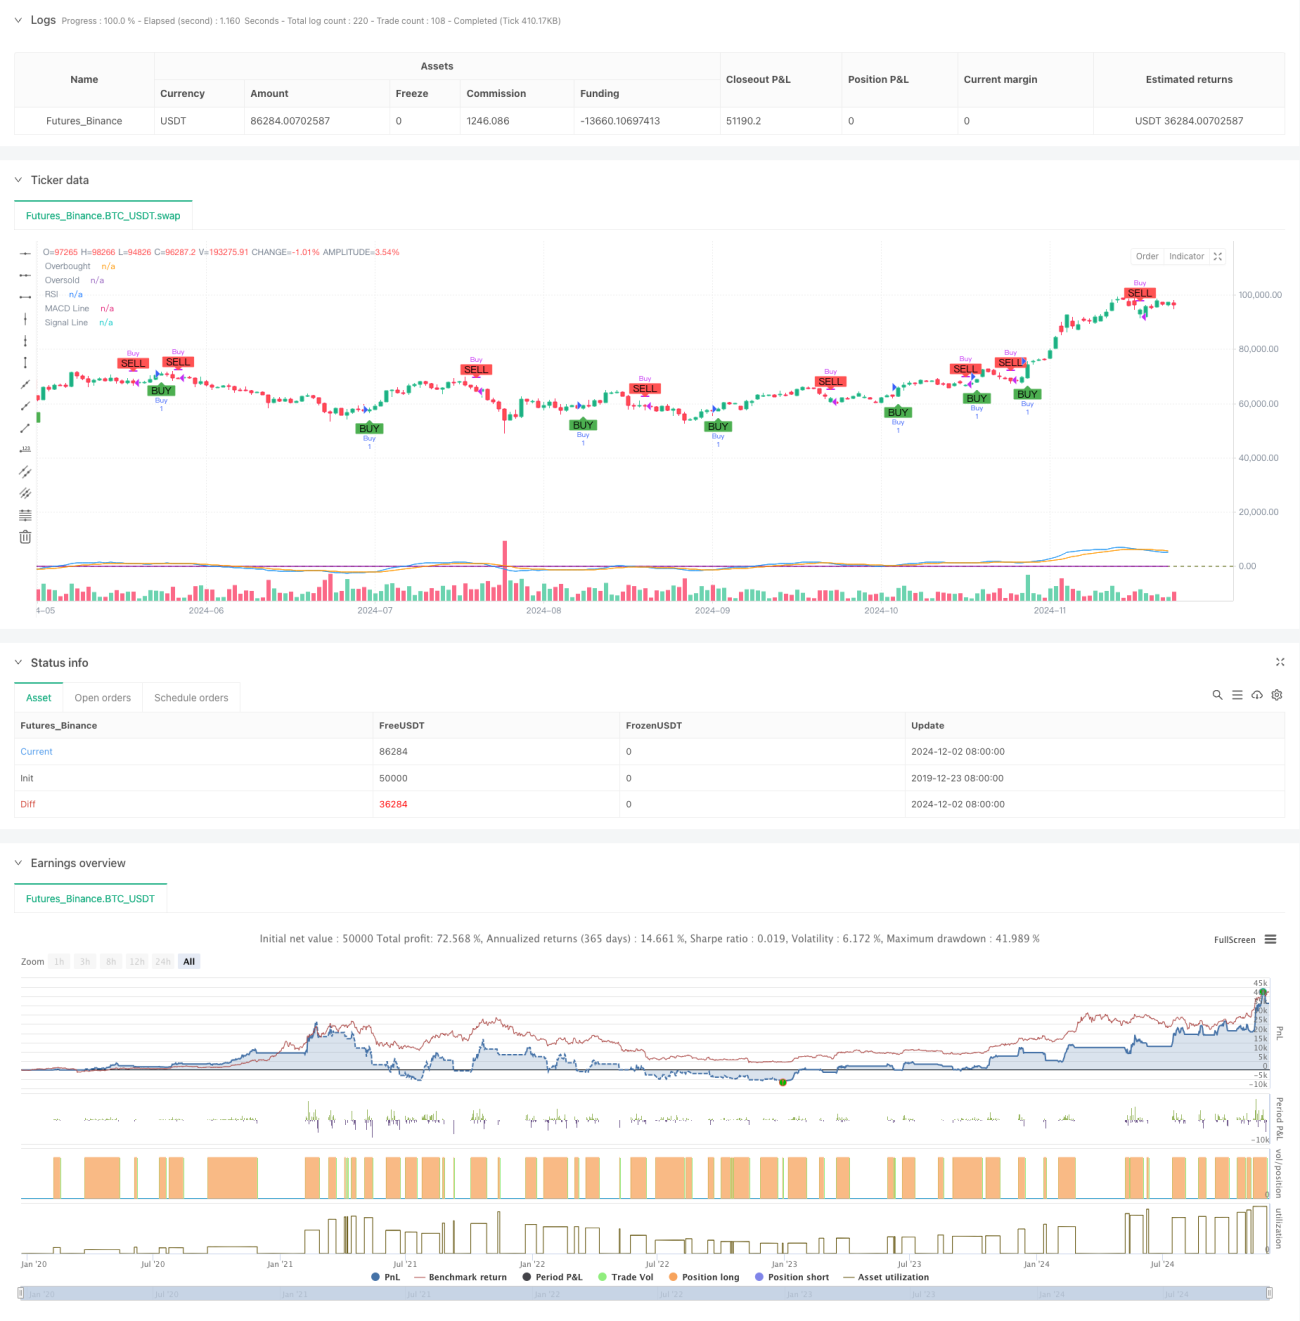
이 전략은 이동 평균 트렌드 이탈 지표 ((MACD) 와 상대적으로 강한 지표 ((RSI) 를 결합한 정량 거래 시스템이다. 이 전략은 이 두 가지 기술 지표의 교차 신호와 오버 바이 오버 셀 레벨을 분석하여 시장 트렌드 전환점을 식별하여 거래 결정을 내린다. 시스템은 프로그래밍 된 거래 방식을 채택하여 자동으로 시장 기회를 포착하고 거래를 할 수 있다.
전략 원칙
전략의 핵심 논리는 두 가지 주요 기술 지표에 기반합니다: MACD와 RSI. MACD 지표는 빠른 이동 평균 (12 시) 과 느린 이동 평균 (26 시) 의 차이를 계산하여 신호 라인 (9 시 이동 평균) 과 비교하여 트렌드 방향을 판단합니다. RSI 지표는 14 주기의 상대적 강점을 계산하여 시장이 과매 또는 과매 상태인지 판단합니다.
MACD 라인이 신호 라인을 상향으로 가로질러 RSI가 70보다 낮으면 구매 신호를 생성하고 MACD 라인이 신호 라인을 상향으로 가로질러 RSI가 30보다 높으면 판매 신호를 생성합니다. 이 이중 확인 메커니즘은 가짜 신호를 효과적으로 필터링 할 수 있습니다.
전략적 이점
- 신호 신뢰성: MACD와 RSI 두 지표의 결합으로 교차 확인, 크게 거짓 신호의 영향을 줄인다.
- 매개 변수 조정: 전략은 다양한 시장 환경에 맞게 MACD와 RSI의 매개 변수를 조정할 수 있습니다.
- 높은 수준의 자동화: 전략은 완전히 프로그램화되어 거래가 자동으로 수행되고 인간의 감정적 간섭이 줄어들 수 있습니다.
- 시각적 효과: 차트에 명확하게 표시된 매매 신호를 분석하고 재검토하기 쉽다.
- 리스크 제어: RSI 초과 구매 초과 판매 수준을 보조 판단으로 사용하여 추가적인 리스크 컨트롤을 제공합니다.
전략적 위험
- 변동 시장 위험: 변동 시장에서 거래 신호가 자주 발생하여 거래 비용이 증가 할 수 있습니다.
- 지연 위험: 이동 평균 계산으로 인해 신호가 지연되어 최적의 입구 지점을 놓칠 수 있다.
- 매개 변수 감수성: 다른 시장 환경에서 최적 매개 변수가 차이가 있을 수 있으며, 주기적으로 조정할 필요가 있다.
- 가짜 브레이크 위험: 시장의 변동이 커질 때 가짜 브레이크 신호가 나타날 수 있다.
전략 최적화 방향
- 변동률 지표를 도입: ATR 또는 변동률 지표를 추가하여 동적으로 조정하는 매개 변수를 고려하십시오.
- 최적화 신호 확인 메커니즘: 수송량과 같은 다른 기술 지표가 신호 확인 조건으로 증가할 수 있다.
- 트렌드 필터를 추가: 더 긴 주기의 이동 평균을 트렌드 필터로 도입한다.
- 손해 방지 제도를 개선: 추적 손해 또는 시간 손해와 같은 더 유연한 손해 방지 전략을 설계하십시오.
- 포지션 관리를 최적화: 신호 강도 및 시장 환경의 동성에 따라 포지션 크기를 조정하십시오.
요약하다
MACD-RSI 동적 교차량 거래 시스템은 기술 분석의 클래식 지표와 결합한 자동화 거래 전략이다. MACD 트렌드 판단과 RSI 오버 구매 오버 판매 확인의 이중 메커니즘을 통해 시장 전환점을 효과적으로 포착할 수 있다. 전략은 높은 신뢰성, 조정성이 강하지만, 흔들림 시장과 신호 지연 등의 위험을 주의해야 한다. 다른 기술 지표와 최적화된 신호 확인 장치를 도입함으로써 전략에는 큰 개선 공간이 있다. 실제 응용에서는 투자자가 특정 시장 환경에 따라 변수를 조정하고 다른 분석 방법과 결합하여 사용하도록 권장한다.
- 1