
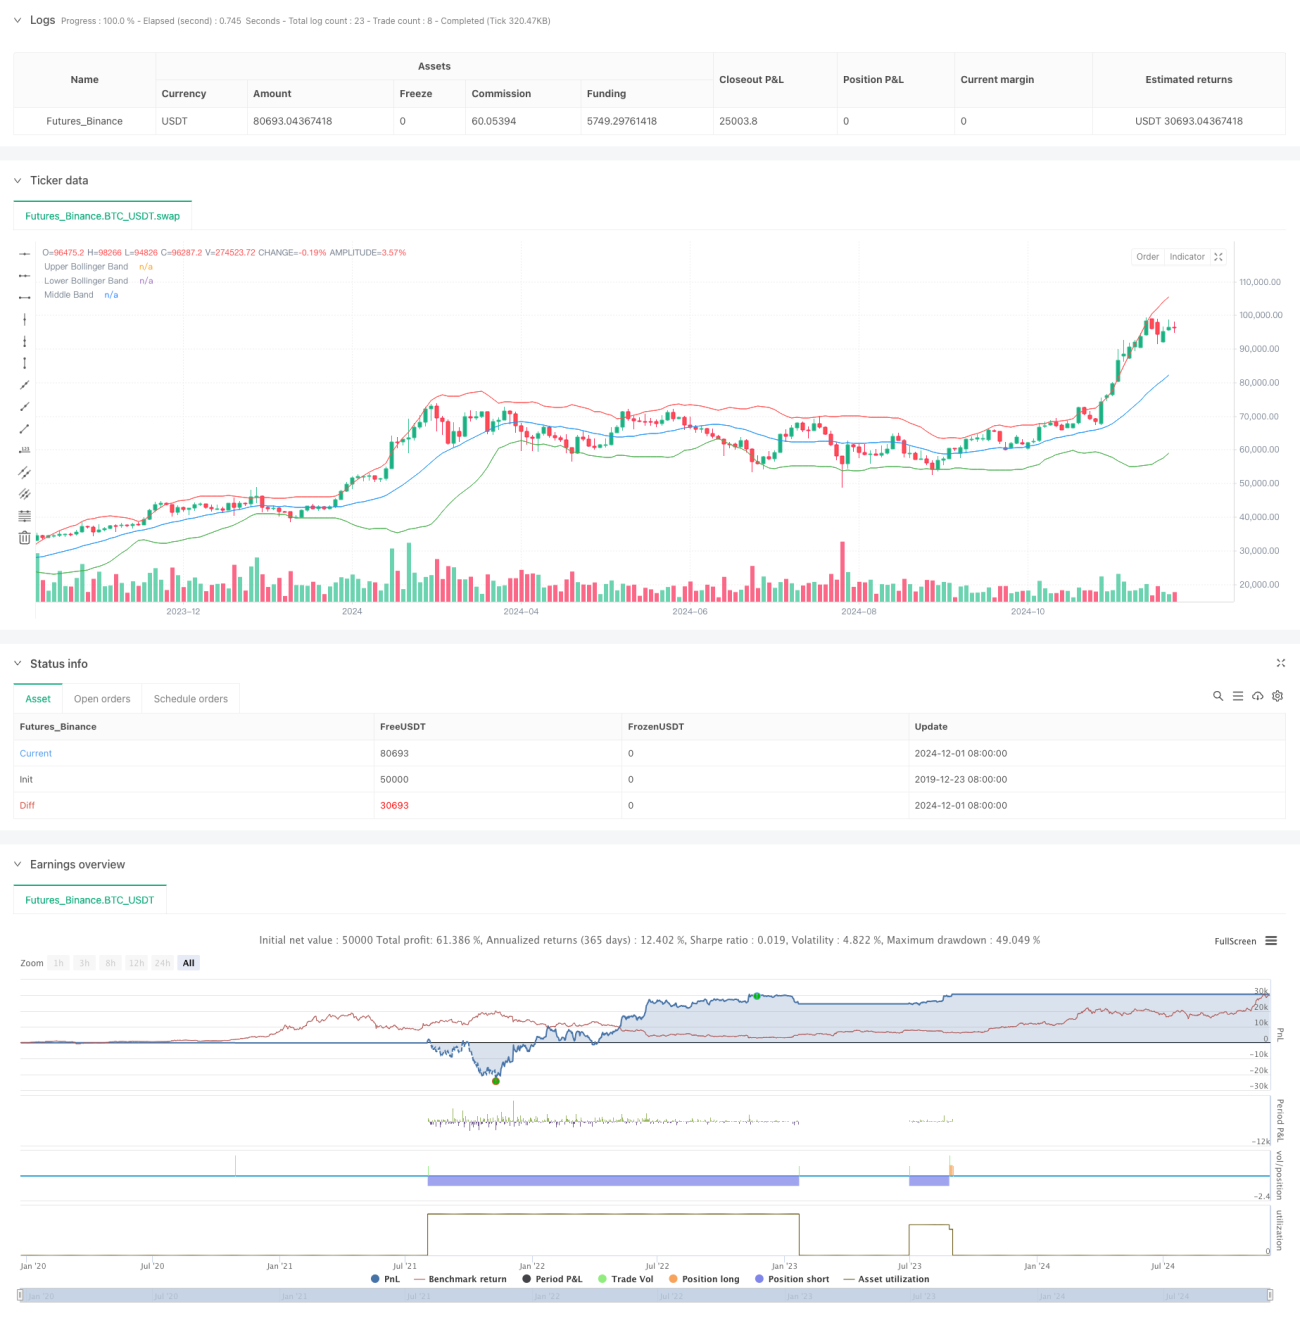
이 전략은 부린띠 지표와 가격 돌파구를 결합한 고주파 거래 시스템이다. 전략은 가격과 부린띠의 위치 관계를 모니터링하여, 이전 고저점 돌파구 신호와 결합하여, 시장에서 과매매가 발생했을 때 역전 거래한다. 시스템은 1:1의 위험 이득 비율을 채택하고, 스톱 손실을 설정하고, 시각적으로 각 핵심 가격을 표시하여, 거래자가 시장 움직임을 직관적으로 이해하도록 돕는다.
이 전략의 핵심 논리는 두 가지 주요 판단 조건에 기반합니다: 가격이 이전 고점을 돌파하고 이전 고점은 브린 밴드 아래의 경로에있을 때, 여러 신호를 트리거합니다. 가격이 이전 저점을 넘어서는 경우, 이전 저점은 브린 밴드 위 경로에있을 때, 빈 신호를 트리거합니다. 브린 밴드 매개 변수는 20 주기의 이동 평균과 2 배의 표준 차이를 사용하여 시장의 변동 범위를 판단합니다.
이것은 여러 가지 기술적 분석 개념을 통합 한 완전한 거래 시스템입니다. 부린 벨트 지표와 가격 돌파구를 결합하는 방식으로 전략은 시장의 과매도 과 판매 영역에서 역전 기회를 잡을 수 있습니다. 약간의 최적화 공간이 있지만 시스템의 기본 프레임 워크는 좋은 확장성과 실용적 가치를 가지고 있습니다. 합리적인 위험 관리 및 매개 변수 최적화를 통해 전략은 실제 거래에서 안정적인 수익을 얻을 수 있습니다.
/*backtest
start: 2019-12-23 08:00:00
end: 2024-12-03 00:00:00
period: 2d
basePeriod: 2d
exchanges: [{"eid":"Futures_Binance","currency":"BTC_USDT"}]
*/
//@version=5
strategy("Bollinger Band Scalping", overlay=true)
// Input for Bollinger Bands length and standard deviation
bbLength = input(20, title="Bollinger Bands Length")
stdDev = input(2.0, title="Bollinger Bands Std Dev")
// Calculate and plot the Bollinger Bands
basis = ta.sma(close, bbLength)
deviation = stdDev * ta.stdev(close, bbLength)
upperBB = basis + deviation
lowerBB = basis - deviation
// Get previous candle's values
prevHigh = high[1] // Previous candle high
prevLow = low[1] // Previous candle low
// Buy Signal Condition: Current high crossed above previous high and previous high is below the lower Bollinger Band
buyCondition = ta.crossover(high, prevHigh) and (prevHigh < lowerBB[1])
// Sell Signal Condition: Current low crossed below previous low and previous low is above the upper Bollinger Band
sellCondition = ta.crossunder(low, prevLow) and (prevLow > upperBB[1])
// Entry and exit for Buy signals
if (buyCondition)
strategy.entry("Buy", strategy.long)
// Calculate target and stop loss
stopLossPrice = prevLow
targetPrice = prevHigh + (prevHigh - stopLossPrice) // 1:1 RR target
// Set stop loss and target orders
strategy.exit("Sell", "Buy", limit=targetPrice, stop=stopLossPrice)
// // Plot entry line
// line.new(x1=bar_index, y1=prevHigh, x2=bar_index + 12, y2=prevHigh, color=color.green, width=2, style=line.style_solid)
// // Plot stop loss line
// line.new(x1=bar_index, y1=stopLossPrice, x2=bar_index + 12, y2=stopLossPrice, color=color.red, width=1, style=line.style_dashed)
// // Plot target line
// line.new(x1=bar_index, y1=targetPrice, x2=bar_index + 12, y2=targetPrice, color=color.blue, width=2, style=line.style_solid)
// Entry and exit for Sell signals
if (sellCondition)
strategy.entry("Sell", strategy.short)
// Calculate target and stop loss
stopLossPriceSell = prevHigh
targetPriceSell = prevLow - (stopLossPriceSell - prevLow) // 1:1 RR target
// Set stop loss and target orders
strategy.exit("Cover", "Sell", limit=targetPriceSell, stop=stopLossPriceSell)
// // Plot entry line
// line.new(x1=bar_index, y1=prevLow, x2=bar_index + 12, y2=prevLow, color=color.red, width=2, style=line.style_solid)
// // Plot stop loss line
// line.new(x1=bar_index, y1=stopLossPriceSell, x2=bar_index + 12, y2=stopLossPriceSell, color=color.green, width=1, style=line.style_dashed)
// // Plot target line
// line.new(x1=bar_index, y1=targetPriceSell, x2=bar_index + 12, y2=targetPriceSell, color=color.blue, width=2, style=line.style_solid)
// Plotting Bollinger Bands with 70% transparency
plot(upperBB, color=color.red, title="Upper Bollinger Band", transp=70)
plot(lowerBB, color=color.green, title="Lower Bollinger Band", transp=70)
plot(basis, color=color.blue, title="Middle Band", transp=70)