개요
이 전략은 비 트렌드 가격 변동 지표 ((DPO) 와 지수 이동 평균 ((EMA) 의 교차를 기반으로 한 양적 거래 전략이다. 전략의 핵심 아이디어는 DPO와 4 주기 EMA의 관계를 비교하여 시장 추세의 변화를 포착하여 구매 및 판매 신호를 생성하는 것이다. 이 전략은 특히 4 시간 이상의 큰 시간 주기에는 적합하며, 평평한 슬라이드 도표를 사용하면 더 효과적이다.
전략 원칙
전략의 핵심 논리에는 다음과 같은 주요 단계가 포함됩니다.
- 24주기 간단한 이동 평균 (SMA) 을 기준으로 계산합니다.
- SMA를 앞으로 이동시켜 (length/2+1) 의 주기를 이동한 후의 SMA값을 얻는다.
- 마감값을 빼고 이동한 SMA를 이용하여 DPO 값을 얻는다.
- DPO의 4주기 지수 이동 평균을 계산합니다.
- DPO가 4주기 EMA를 통과하면 구매 신호가 생성됩니다.
- DPO 아래에서 4주기 EMA를 통과할 때, 판매 신호를 생성한다
전략적 이점
- 신호 명확성: 교차 신호를 통해 명확한 매매점을 생성하여 주관적인 판단을 피합니다.
- 트렌드 추적 효과: DPO 지표는 시장 소음을 효과적으로 필터링하여 주요 트렌드를 더 잘 잡을 수 있습니다.
- 더 적은 시간 지연: 짧은 주기 ((4주기) EMA를 신호선으로 사용하여 시장 변화에 더 빠르게 반응할 수 있다.
- 적응력: 전략은 다양한 시장 환경에 적응할 수 있습니다.
- 간단한 동작: 명확하고 이해하기 쉽고 실행하기 쉬운 전략 논리
전략적 위험
- 변동성 있는 시장의 위험: 횡보 및 변동성 있는 시장에서는 빈번하게 잘못된 신호가 발생할 수 있습니다.
- 지연 위험: 단기 EMA를 사용함에도 불구하고 약간의 지연이 존재합니다.
- 트렌드 리버스 위험: 강력한 트렌드가 급격하게 변할 경우 큰 손실이 발생할 수 있습니다.
- 매개 변수 민감성: 정책 효과는 주기 매개 변수의 선택에 민감하다
- 시장 조건 의존성: 전략이 특정 시장 조건에서 이상적으로 작동하지 않을 수 있습니다.
전략 최적화 방향
- 진동율 필터를 도입: ATR 또는 다른 진동율 지표를 추가하여 낮은 진동율 환경의 신호를 필터링할 수 있다
- 증가 추세 확인: ADX와 같은 다른 추세 지표와 결합하여 추세 강도를 확인
- 최적화 중지 설정: 시장의 변동성에 따라 중지 위치를 조정할 수 있습니다.
- 개선된 신호 필터링: 거래량 확인 또는 다른 기술 지표를 추가하여 가짜 신호를 필터링
- 매개 변수 적응: 다른 시장 환경에 적응하기 위해 매개 변수를 동적으로 최적화합니다.
요약하다
DPO-EMA 트렌드 크로스 전략은 구조가 단순하지만 효과는 뚜렷한 양적 거래 전략이다. 탈 트렌드 흔들림 지표와 이동 평균을 결합하여 이 전략은 시장 추세 변화를 효과적으로 포착할 수 있다. 일부 고유한 위험이 존재하지만, 합리적인 최적화 및 위험 관리 조치를 통해 이 전략은 여전히 실전 적용 가치가 있다. 중장기 거래자에게는 고려할 가치가 있는 전략 선택이다.
전략 소스 코드
/*backtest
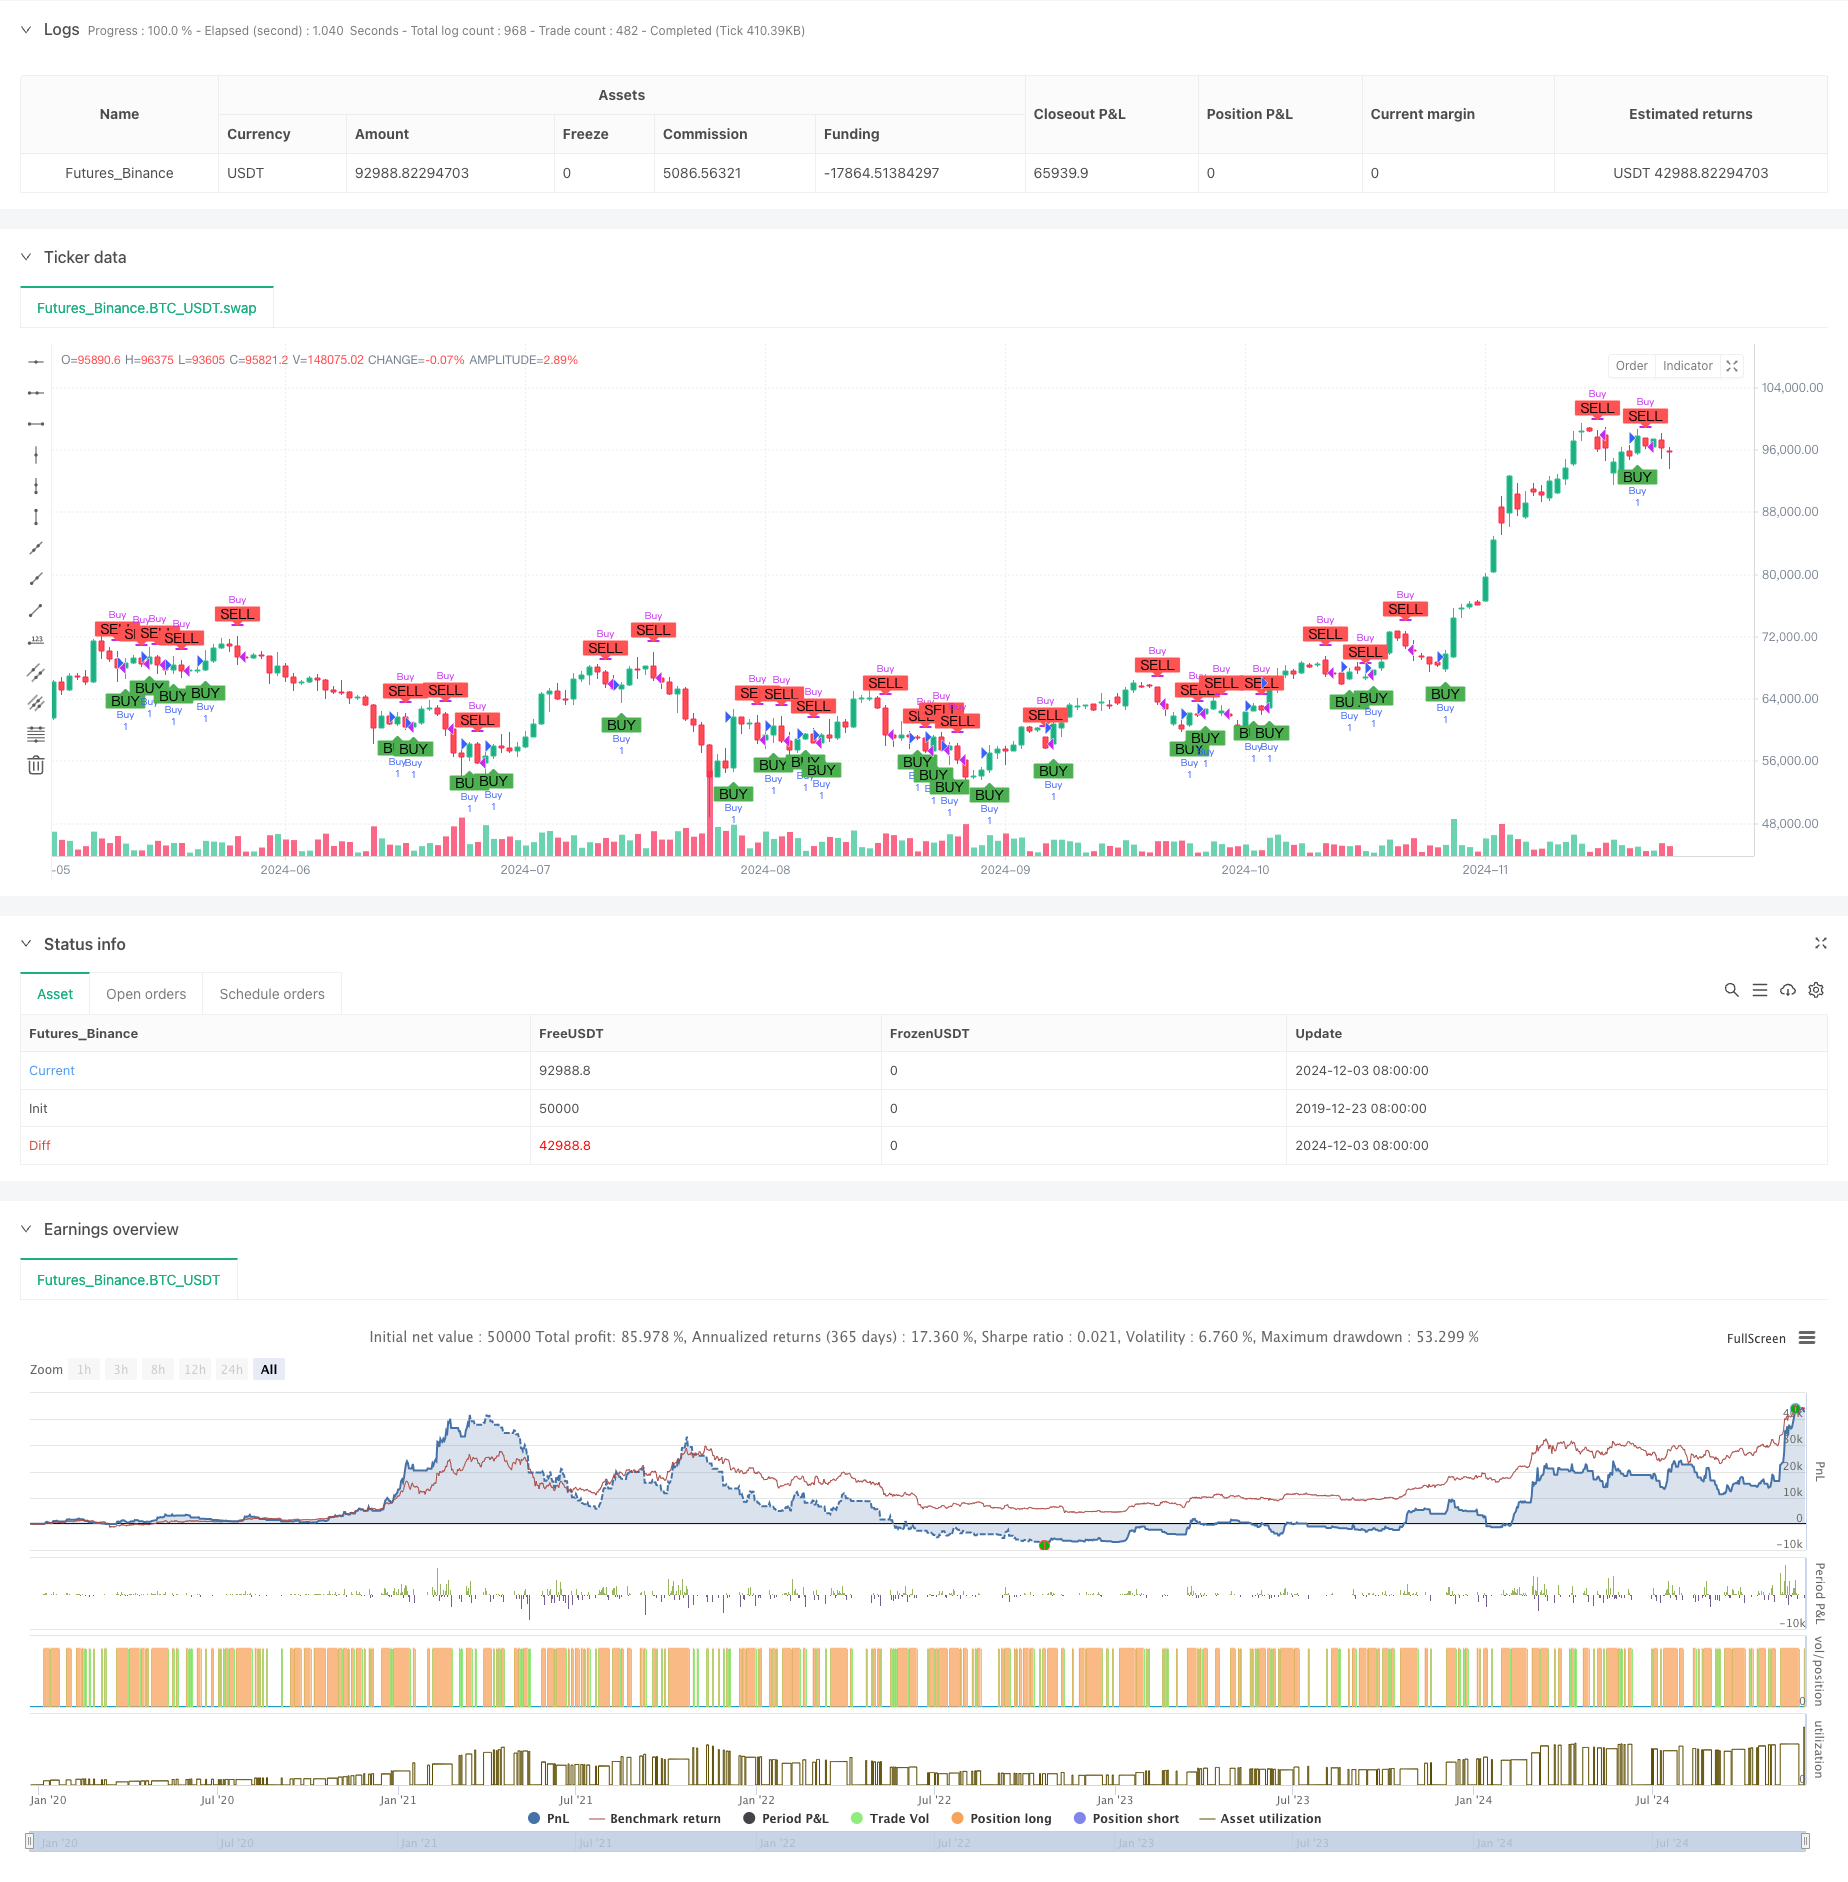
start: 2019-12-23 08:00:00
end: 2024-12-04 00:00:00
period: 1d
basePeriod: 1d
exchanges: [{"eid":"Futures_Binance","currency":"BTC_USDT"}]
*/
//@version=5
strategy("DPO 4,24 Strategy", shorttitle="DPO Strategy", overlay=true)
// Define a fixed lookback period and EMA length
length = 24
ema_length = 4
// Calculate the Simple Moving Average (SMA) of the closing prices
sma = ta.sma(close, length)
// Calculate the shifted SMA value
shifted_sma = sma[length / 2 + 1]
// Calculate the Detrended Price Oscillator (DPO)
dpo = close - shifted_sma
// Calculate the 4-period Exponential Moving Average (EMA) of the DPO
dpo_ema = ta.ema(dpo, ema_length)
// Generate buy and sell signals based on crossovers
buy_signal = ta.crossover(dpo, dpo_ema)
sell_signal = ta.crossunder(dpo, dpo_ema)
// Overlay buy and sell signals on the candlestick chart
plotshape(series=buy_signal, location=location.belowbar, color=color.green, style=shape.labelup, text="BUY")
plotshape(series=sell_signal, location=location.abovebar, color=color.red, style=shape.labeldown, text="SELL")
// Strategy entry and exit conditions
if (buy_signal)
strategy.entry("Buy", strategy.long)
if (sell_signal)
strategy.close("Buy")