5개 이동 평균 RSI 추세 추적 동적 채널 거래 시스템

EMA RSI DC
생성 날짜: 2024-12-05 15:15:28 마지막으로 수정됨: 2024-12-05 15:15:28
복사: 0 클릭수: 445
avatar of ChaoZhang ChaoZhang
1
집중하다
1617
수행원

5개 이동 평균 RSI 추세 추적 동적 채널 거래 시스템

개요

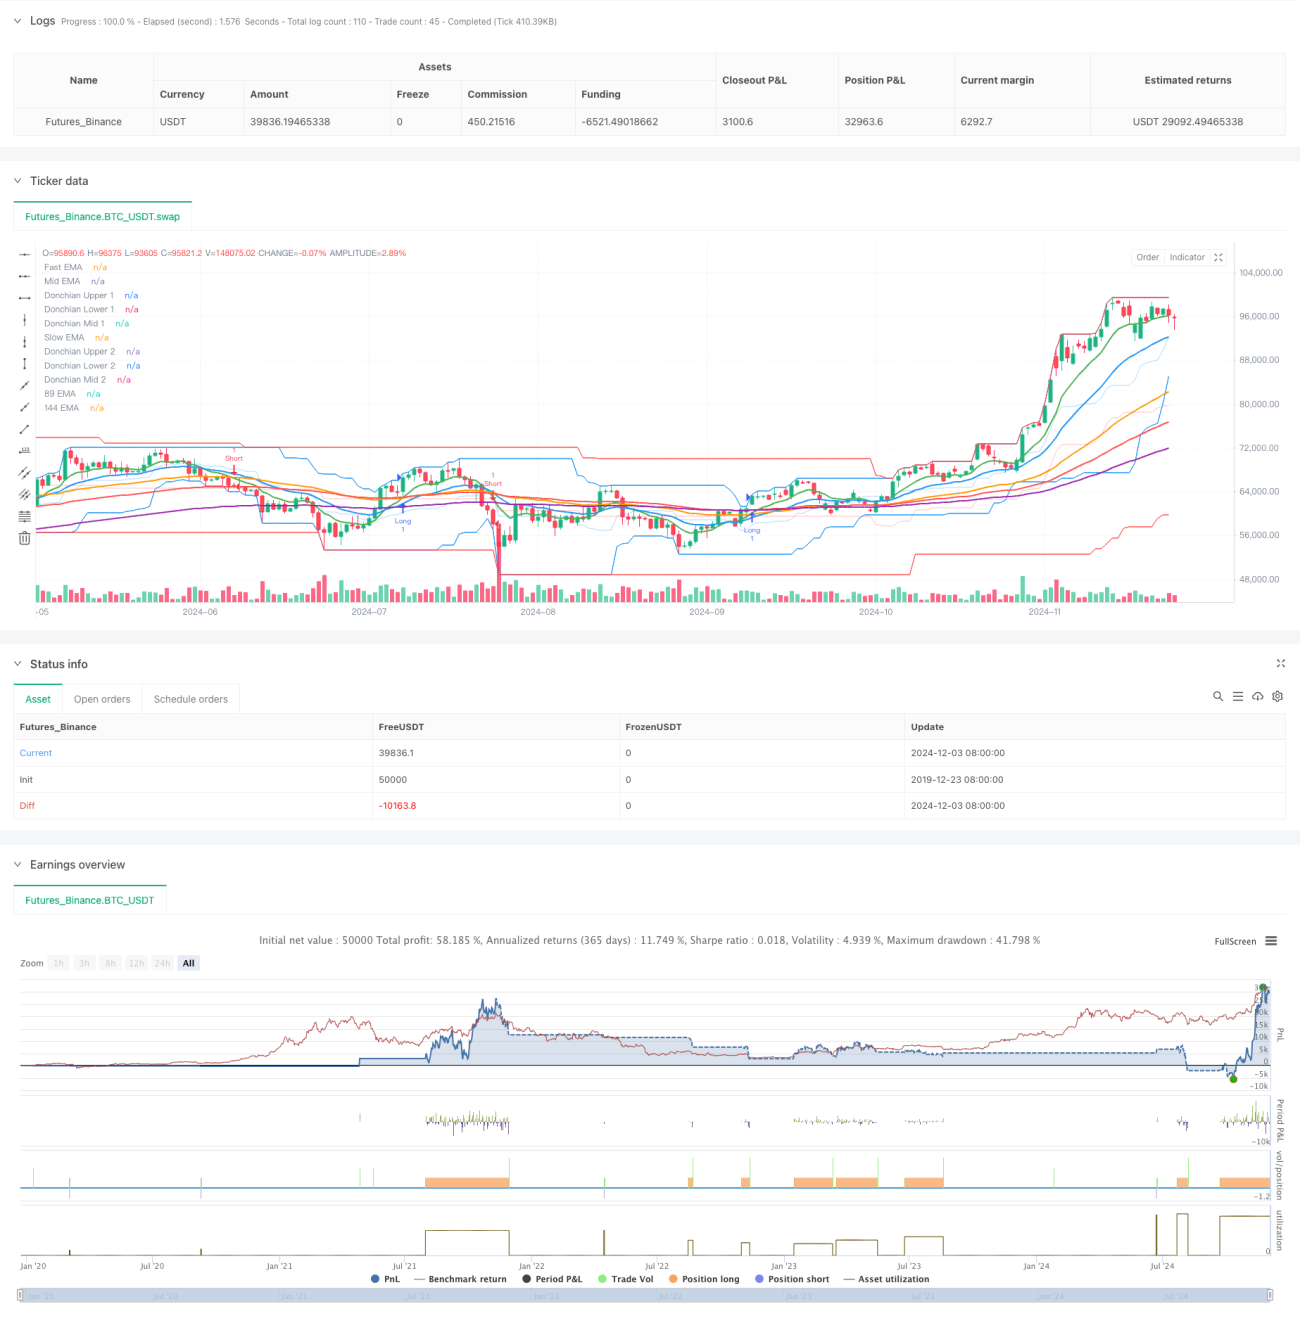
이 전략은 다중 기술 지표의 결합으로 트렌드 추적 시스템, 주로 5 개의 다른 기간의 지수 이동 평균 (EMA), 상대적으로 강한 지표 (RSI) 및 두 개의 다른 기간의 돈치안 채널 (Donchian Channel) 을 통합합니다. 시스템은 다중 지표의 조합을 통해 시장 추세를 포착하고, 동적 스톱 손실과 수익 목표를 사용하여 위험과 수익을 관리합니다.

전략 원칙

전략은 다층적인 기술 지표로 신호 확인을 한다: 먼저 5개의 EMA (9, 21, 55, 89, 144주기) 를 사용하여 트렌드 프레임워크를 구축하고, 빠른 EMA와 느린 EMA의 교차를 통해 초기 트렌드 방향을 결정한다. 다음으로, RSI (주기 14) 를 트렌드 필터로 사용하여, RSI가 초매권 (60 이상) 에서만 더 많이 허용하도록 하고, 초매권 (40 이하) 에서만 공백을 허용하도록 하고, 이렇게 하면 평형 시장에서 자주 거래되는 것을 피할 수 있다. 마지막으로, 21주기 및 74주기의 돈치안 통로를 통해 가격 변동 범위를 결정하고, 거래에 대한 더 많은 시장 구조를 제공한다.

전략적 이점

  1. 다중 기술 지표 교차 검증, 신호 신뢰성 향상
  2. 트렌드 추적과 동력 지표의 조합으로 트렌드 시장에서 좋은 성과를 얻을 수 있습니다.
  3. 동적 정지 및 다중 이익 목표를 사용하여 자금을 보호하고 동향을 최대한 활용할 수 있습니다.
  4. RSI 필터링 신호를 통해 정렬 시장의 가짜 신호를 줄이십시오.
  5. 높은 수준의 시스템 자동화로 인간의 개입으로 인한 감정적 영향을 줄입니다.

전략적 위험

  1. 다중 지표는 신호 지연을 유발할 수 있으며, 급격한 반전 시장에서 더 큰 반전을 일으킬 수 있습니다.
  2. RSI 필터링은 중요한 트렌드 시작점을 놓칠 수 있습니다.
  3. 고정 비율의 스톱 로즈 및 수익 설정은 모든 시장 환경에 적합하지 않을 수 있습니다.
  4. 높은 변동성이 있는 시장에서 자주 스톱로스를 만질 수 있습니다.
  5. 너무 많은 기술 지표로 인해 시스템이 지나치게 최적화 될 수 있습니다.

전략 최적화 방향

  1. 시장의 변동에 따라 동적으로 조정하는 적응된 지표 매개 변수를 도입합니다.
  2. 보조 확인으로 볼륨 표시기 추가
  3. 추적 중지 또는 ATR 기반의 동적 중지와 같은 더 유연한 중지 솔루션을 개발
  4. 시장 환경 식별 메커니즘에 가입하여 다른 시장 조건에 따라 다른 파라미터 설정을 사용합니다.
  5. 시간 필터를 추가하는 것을 고려하여 거래가 안되는 시간에 포지션을 열지 마십시오.

요약하다

이 전략은 여러 가지 기술 지표의 조합을 통해 비교적 완전한 거래 시스템을 구축한다. 약간의 지연이 있음에도 불구하고, 엄격한 신호 필터링과 위험 관리를 통해 트렌드 시장에서 안정적인 수익을 얻을 수 있다. 거래자는 실제 적용에서 특정 시장 특성과 자신의 위험 용량에 따라 매개 변수를 적절하게 조정하도록 권장한다. 동시에, 시스템의 성능을 지속적으로 모니터링하고, 정기적으로 최적화 방향을 평가하여 전략이 항상 시장 변화에 적응하도록 보장한다.

전략 소스 코드
/*backtest
start: 2019-12-23 08:00:00
end: 2024-12-04 00:00:00
period: 1d
basePeriod: 1d
exchanges: [{"eid":"Futures_Binance","currency":"BTC_USDT"}]
*/

//@version=5
strategy("EMA RSI Donchian Strategy", overlay=true)

// Input parameters
fastEmaLength = input(9, title="Fast EMA Length")
midEmaLength = input(21, title="Mid EMA Length")
slowEmaLength = input(55, title="Slow EMA Length")
ema89Length = input(89, title="89 EMA Length")
ema144Length = input(144, title="144 EMA Length")
rsiPeriod = input(14, title="RSI Period")
rsiOverbought = input(60, title="RSI Overbought Level")
rsiOversold = input(40, title="RSI Oversold Level")
donchianLength1 = input(21, title="Donchian Channel Length 1")
donchianLength2 = input(74, title="Donchian Channel Length 2")

// EMA calculations
fastEma = ta.ema(close, fastEmaLength)
midEma = ta.ema(close, midEmaLength)
slowEma = ta.ema(close, slowEmaLength)
ema89 = ta.ema(close, ema89Length)
ema144 = ta.ema(close, ema144Length)

// RSI calculation
rsi = ta.rsi(close, rsiPeriod)

// Donchian Channel calculations
donchianUpper1 = ta.highest(high, donchianLength1)
donchianLower1 = ta.lowest(low, donchianLength1)
donchianUpper2 = ta.highest(high, donchianLength2)
donchianLower2 = ta.lowest(low, donchianLength2)
donchianMid1 = (donchianUpper1 + donchianLower1) / 2
donchianMid2 = (donchianUpper2 + donchianLower2) / 2

// Plot EMAs
plot(fastEma, color=color.green, linewidth=2, title="Fast EMA")
plot(midEma, color=color.blue, linewidth=2, title="Mid EMA")
plot(slowEma, color=color.orange, linewidth=2, title="Slow EMA")
plot(ema89, color=color.red, linewidth=2, title="89 EMA")
plot(ema144, color=color.purple, linewidth=2, title="144 EMA")

// Plot Donchian Channels
plot(donchianUpper1, color=color.new(color.blue, 0), title="Donchian Upper 1")
plot(donchianLower1, color=color.new(color.blue, 0), title="Donchian Lower 1")
plot(donchianMid1, color=color.new(color.blue, 80), title="Donchian Mid 1")
plot(donchianUpper2, color=color.new(color.red, 0), title="Donchian Upper 2")
plot(donchianLower2, color=color.new(color.red, 0), title="Donchian Lower 2")
plot(donchianMid2, color=color.new(color.red, 80), title="Donchian Mid 2")

// Entry Conditions
longCondition = ta.crossover(fastEma, slowEma) and rsi > rsiOverbought
shortCondition = ta.crossunder(fastEma, slowEma) and rsi < rsiOversold

// Stop Loss and Take Profit
var float longStopLoss = na
var float longTakeProfit1 = na
var float longTakeProfit2 = na
var float shortStopLoss = na
var float shortTakeProfit1 = na
var float shortTakeProfit2 = na

if longCondition
    longStopLoss := high * 0.99
    longTakeProfit1 := longStopLoss * 1.02618
    longTakeProfit2 := longStopLoss * 1.036185
    strategy.entry("Long", strategy.long)
    
if shortCondition
    shortStopLoss := low * 1.01
    shortTakeProfit1 := shortStopLoss * 0.97382
    shortTakeProfit2 := shortTakeProfit1 * 0.96381
    strategy.entry("Short", strategy.short)

// Exit Conditions
if not na(longStopLoss)
    strategy.exit("Take Profit 1", "Long", limit=longTakeProfit1)
    strategy.exit("Take Profit 2", "Long", limit=longTakeProfit2)
    strategy.exit("Stop Loss", "Long", stop=longStopLoss)

if not na(shortStopLoss)
    strategy.exit("Take Profit 1", "Short", limit= shortTakeProfit1)
    strategy.exit("Take Profit 2", "Short", limit=shortTakeProfit2)
    strategy.exit("Stop Loss", "Short", stop=shortStopLoss)

// Labels for buy and sell signals
if longCondition
    label.new(bar_index, low, "Buy", color=color.green, style=label.style_label_up, textcolor=color.white)

if shortCondition
    label.new(bar_index, high, "Sell", color=color.red, style=label.style_label_down, textcolor=color.white)

// Alerts
alertcondition(longCondition, title="Long Entry Alert", message="Long entry signal")
alertcondition(shortCondition, title="Short Entry Alert", message="Short entry signal")