G채널과 EMA 트렌드 필터 트레이딩 시스템

1
Follow
1781
Followers
개요
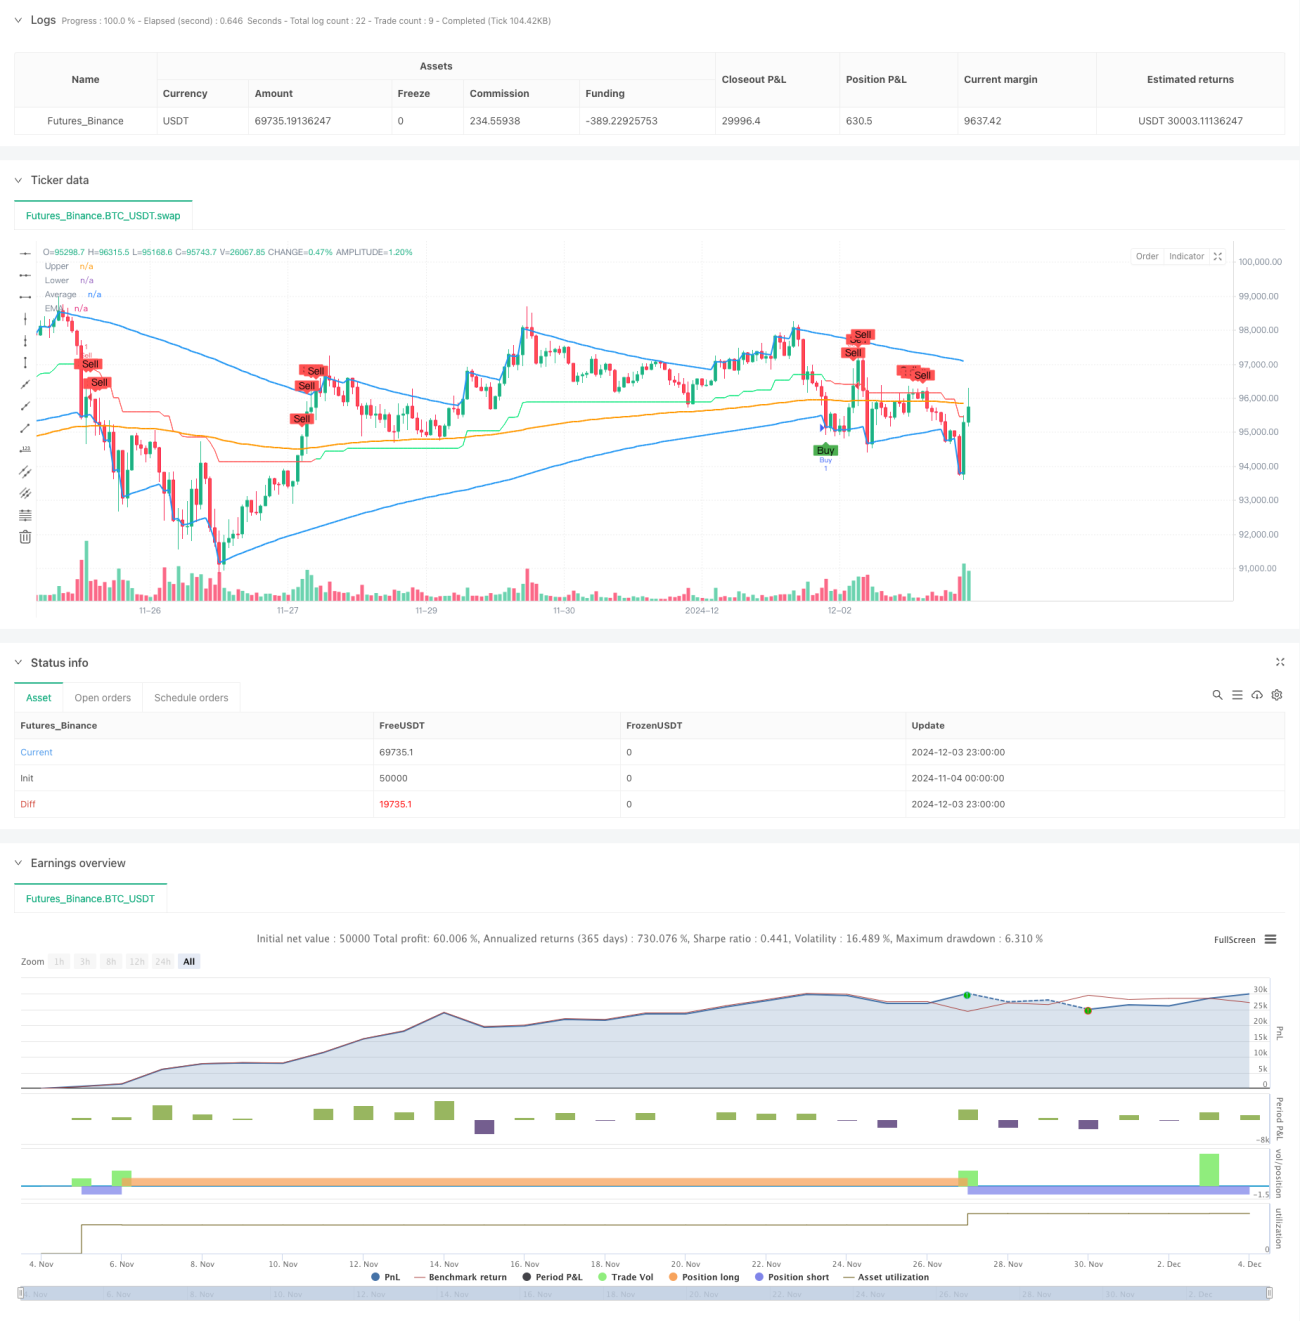
이 전략은 사용자 정의 G 채널과 지수 이동 평균 (EMA) 에 기반한 트렌드 추적 거래 시스템이다. G 채널은 상단 (a), 하단 (b) 및 중도 (avg) 로 구성되어 있으며, 현재 및 역사적 가격을 동적으로 계산하여 채널 경계를 결정한다. 이 전략은 EMA를 트렌드 필터로 결합하여 가격과 채널 라인의 교차 및 EMA와의 위치 관계를 통해 거래 신호를 생성하여 시장 트렌드 전환점을 효과적으로 포착한다.
전략 원칙
전략의 핵심 논리에는 두 가지 주요 구성 요소가 포함되어 있습니다: G 채널과 EMA 필터. G 채널의 계산은 현재 가격과 역사 데이터를 기반으로, 적응 알고리즘을 통해 채널 폭을 동적으로 조정합니다. 상궤도 (a) 는 현재 가격과 이전 단계의 상궤도의 큰 값을 가져다가 채널 폭과 길이 파라미터에 따라 동적으로 조정합니다. 하궤도 (b) 는 유사한 방법을 사용하여 최소 값을 계산합니다. 중궤도는 상하궤도의 수학적 평균입니다.
전략적 이점
- 자기 적응성: G 채널은 시장의 변동에 따라 채널 폭을 자동으로 조정하여 다른 시장 환경에 적응할 수 있습니다.
- 트렌드 확인: EMA를 필터로 사용하여 거래 신호의 신뢰도를 높였습니다.
- 리스크 제어: 통로 돌파 및 트렌드 확인의 이중 검증 메커니즘을 통해 가짜 신호의 위험을 줄입니다.
- 신호 명확성: 거래 조건이 명확하여 프로그램적으로 구현하고 재검토 검증을 용이하게 합니다.
- 시각화 지원: 전략은 분석과 판단을 위한 완전한 그래픽 표현을 제공합니다.
전략적 위험
- 트렌드 지연: EMA는 지연된 지표로 인해 출전 시기가 지연될 수 있다.
- 흔들림 시장 위험: 가로판 흔들림 시장에서 빈번한 가짜 브레이크 신호가 발생할 수 있다.
- 매개 변수 민감성: 채널 길이와 EMA 주기 선택이 전략 성능에 큰 영향을 미칩니다.
- 시장 환경 의존성: 전략은 트렌드가 뚜렷한 시장에서 잘 작동하지만, 흔들리는 시장에서는 좋지 않을 수 있다.
전략 최적화 방향
- 변동률 지표 도입: 시장 변동률에 따라 채널 매개 변수를 조정하여 전략 적응력을 향상시킬 수 있다.
- 시장 환경 필터를 추가: 시장 환경 판단 메커니즘을 추가하여 다른 시장 상태에서 다른 파라미터 설정을 사용합니다.
- 최적화 중지 메커니즘: 채널 너비에 기반한 동적 중지 프로그램을 설계하여 위험 제어 능력을 향상시킵니다.
- 신호 필터링을 개선: 수요량, 변동률 등의 보조 지표를 증가시켜 신호 품질을 향상시킨다.
- 매개 변수 최적화: 다양한 시장 환경에서의 최적의 매개 변수 조합을 피드백으로 최적화한다.
요약하다
G 통로와 EMA 트렌드 필터링 거래 시스템은 통로 돌파와 트렌드 추적을 결합한 완전한 거래 전략이다. G 통로의 역동적인 특성과 EMA의 트렌드 확인 기능을 통해 이 전략은 시장 전환점을 효과적으로 포착하고 거래 위험을 통제할 수 있다.
Source
Pine
Strategy parameters
Related strategies
Comment
All comments (0)
No data
- 1