
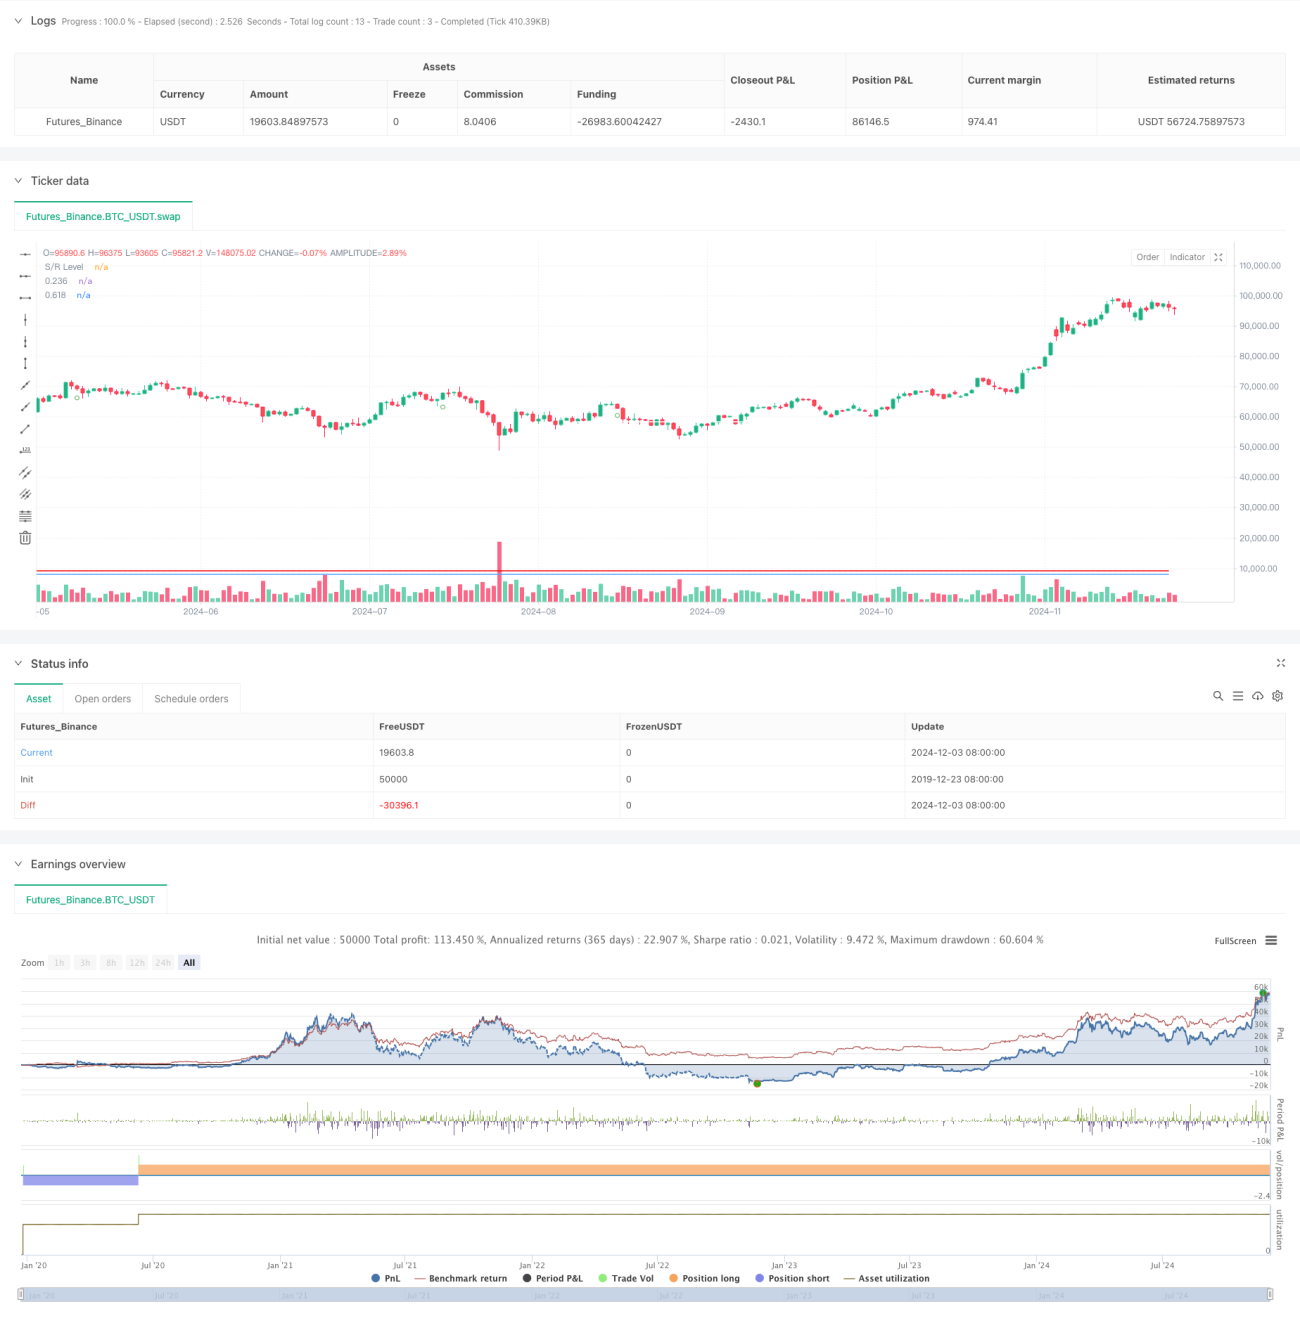
이것은 다중 기술 분석 형태 식별과 지지 저항 수준을 결합한 전략 시스템이다. 이 전략은 주로 이중 바닥 형태 (아담과 이브의 바닥 형태) 를 식별하여 피보나치 회귀 레벨과 지지 저항 라인을 결합하여 거래 결정을 내린다. 전략의 핵심은 다차원 기술 지표 검증을 통해 거래 신호의 신뢰성을 높이고, 지지 저항 수준을 위험 제어의 중요한 참조로 사용한다.
전략은 트리플 검증 메커니즘을 사용하여 거래 결정을 내립니다. 우선, 특정 알고리즘을 통해 더 날카로운 “아담 바닥”과 더 둥근 “에바 바닥”을 포함한 두 개의 바닥 형태를 식별합니다. 다음으로, 피포나치 회귀 레벨 ((0.618 및 1.618) 을 사용하여 목표 지역을 결정합니다. 마지막으로, 지원 저항 레벨의 검증을 통해 거래 신호를 확인합니다. 거래 신호의 생성에는 형태 식별, 피포나치 레벨 및 지원 저항 레벨의 조건을 동시에 충족해야 합니다. 구체적으로, 지원 저항 수준이 1.618 피포나치 연장 지점보다 높으면 다중 신호를 유발하고, 지원 저항 수준이 0.618 피포나치 회귀 지점보다 낮으면 공중 신호를 유발합니다.
이 전략은 형태 인식, 피보나치 레벨 및 지지 저항선과 같은 여러 가지 기술 분석 방법을 통합하여 비교적 완벽한 거래 시스템을 구축했습니다. 이 전략의 장점은 여러 가지 검증 메커니즘이 높은 신뢰성을 제공한다는 것입니다. 또한 조정 가능성은 다양한 시장 환경에 적응할 수있게합니다.
/*backtest
start: 2019-12-23 08:00:00
end: 2024-12-04 00:00:00
period: 1d
basePeriod: 1d
exchanges: [{"eid":"Futures_Binance","currency":"BTC_USDT"}]
*/
//@version=5
strategy("Double Bottom with Support/Resistance Strategy - Aynet", overlay=true)
// Inputs
lookbackPeriod = input(21, "Lookback Period")
swingLowThreshold = input(1.5, "Swing Low Threshold")
fibLevel1 = input(0.618, "Fibonacci Level 1")
fibLevel3 = input(1.618, "Fibonacci Level 2")
srPeriod = input(21, "Support/Resistance Period")
srThreshold = input(3, "Support/Resistance Touch Points")
// Support/Resistance Function
get_sr_level(idx) =>
var level = 0.0
var count = 0
if bar_index % srPeriod == 0
highCount = 0
lowCount = 0
for i = 0 to srPeriod - 1
if math.abs(high[i] - high) < (high * 0.001)
highCount += 1
if math.abs(low[i] - low) < (low * 0.001)
lowCount += 1
if highCount >= srThreshold
level := high
count := highCount
if lowCount >= srThreshold
level := low
count := lowCount
[level, count]
// Pattern Detection Functions
isSwingLow(src, left, right) =>
isLow = true
for i = 0 to left + right
if src[i] < src[right]
isLow := false
isLow
getSpikeSharpness(index) =>
priceRange = high[index] - low[index]
bodyRange = math.abs(close[index] - open[index])
sharpness = priceRange / bodyRange
sharpness
// Pattern Variables
var float firstBottom = na
var float secondBottom = na
var bool isAdam = false
var bool isEve = false
var float level1Value = na
var float level3Value = na
// Pattern Detection
bottom = isSwingLow(low, lookbackPeriod, lookbackPeriod)
if bottom
sharpness = getSpikeSharpness(0)
if na(firstBottom)
firstBottom := low
isAdam := sharpness > swingLowThreshold
else if low <= firstBottom * 1.02 and low >= firstBottom * 0.98
secondBottom := low
isEve := sharpness <= swingLowThreshold
// Calculate Fibonacci
if not na(secondBottom)
highPoint = ta.highest(high, lookbackPeriod)
fibDistance = highPoint - math.min(firstBottom, secondBottom)
level1Value := math.min(firstBottom, secondBottom) + fibDistance * fibLevel1
level3Value := math.min(firstBottom, secondBottom) + fibDistance * fibLevel3
// Get S/R Level
[srLevel, srCount] = get_sr_level(0)
// Trading Logic
longCondition = srLevel > level3Value
shortCondition = srLevel < level1Value
if longCondition
strategy.entry("Long", strategy.long)
if shortCondition
strategy.entry("Short", strategy.short)
// Reset Pattern
if high > ta.highest(high[1], lookbackPeriod)
firstBottom := na
secondBottom := na
isAdam := false
isEve := false
var table logo = table.new(position.top_right, 1, 1)
table.cell(logo, 0, 0, 'Double Bottom with Support/Resistance Strategy - Aynet', text_size=size.large, text_color=color.white)
// Plots
plot(level1Value, "0.236", color=color.rgb(245, 0, 0), style=plot.style_line)
plot(level3Value, "0.618", color=color.rgb(82, 166, 255), style=plot.style_line)
plot(srLevel, "S/R Level", color=color.white)
plotshape(bottom and not na(firstBottom) and na(secondBottom), "Adam Bottom", shape.circle, location.belowbar, color.green)
plotshape(bottom and not na(secondBottom), "Eve Bottom", shape.circle, location.belowbar, color.yellow)