
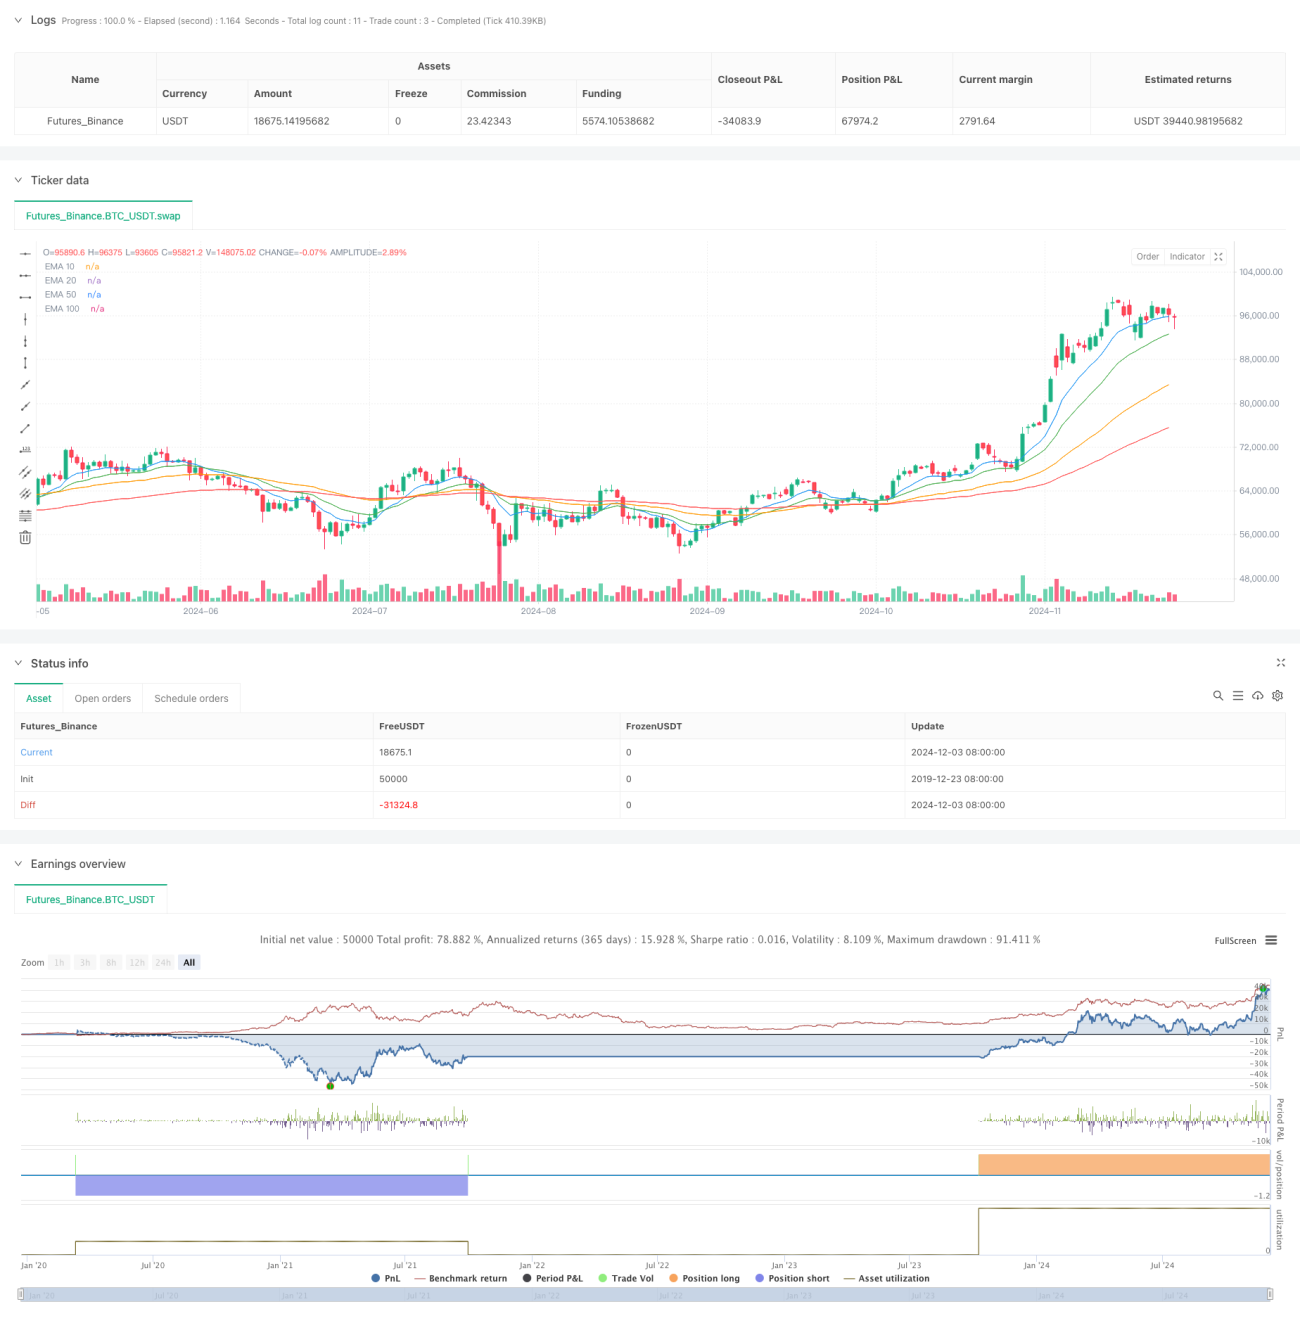
이 전략은 다중 지수 이동 평균 (EMA), 상대적으로 강한 지수 (RSI) 및 이동 평균 동향 분산 지수 (MACD) 을 결합한 정량 거래 시스템입니다. 이 전략은 다중 기술 지표를 조율하여 완전한 거래 의사 결정 프레임워크를 형성합니다. 이 전략은 10, 20, 50 및 100 일 EMA 가이 라인을 주요 트렌드 판단 도구로 사용하고 RSI와 MACD를 보조 확인 지표로 결합하여 위험을 제어하기 위해 중지 및 중지 지표를 설정합니다.
전략의 핵심 논리는 다음과 같은 핵심 요소에 기초합니다.
이것은 합리적이고 논리적으로 설계된 정량 거래 전략이다. 여러 기술 지표의 조합 사용으로 시장 추세를 효과적으로 포착 할 수 있으며, 완벽한 위험 제어 장치가 있습니다. 전략의 최적화 공간은 넓고, 지속적인 개선과 조정으로 더 나은 거래 효과를 얻을 수 있습니다. 실체 거래 전에 충분한 피드백 검증을 수행하고, 특정 시장 상황에 따라 적절한 매개 변수 설정을 조정하는 것이 좋습니다.
/*backtest
start: 2019-12-23 08:00:00
end: 2024-12-04 00:00:00
period: 1d
basePeriod: 1d
exchanges: [{"eid":"Futures_Binance","currency":"BTC_USDT"}]
*/
//@version=5
strategy("4 EMA Strategy with RSI & MACD", shorttitle="4 EMA + RSI + MACD", overlay=true)
// Input EMA periods
ema1 = input(10, title="EMA 1")
ema2 = input(20, title="EMA 2")
ema3 = input(50, title="EMA 3")
ema4 = input(100, title="EMA 4")
// Input RSI & MACD settings
rsiLength = input(14, title="RSI Length")
rsiOverbought = input(70, title="RSI Overbought")
rsiOversold = input(30, title="RSI Oversold")
macdFast = input(12, title="MACD Fast Length")
macdSlow = input(26, title="MACD Slow Length")
macdSignal = input(9, title="MACD Signal Length")
// Stop Loss and Take Profit Inputs
stopLossPct = input.float(1.5, title="Stop Loss %") / 100
takeProfitPct = input.float(3, title="Take Profit %") / 100
// Calculate EMAs
ema_1 = ta.ema(close, ema1)
ema_2 = ta.ema(close, ema2)
ema_3 = ta.ema(close, ema3)
ema_4 = ta.ema(close, ema4)
// Calculate RSI
rsi = ta.rsi(close, rsiLength)
// Calculate MACD
[macdLine, signalLine, _] = ta.macd(close, macdFast, macdSlow, macdSignal)
// Plot EMAs
plot(ema_1, color=color.blue, title="EMA 10")
plot(ema_2, color=color.green, title="EMA 20")
plot(ema_3, color=color.orange, title="EMA 50")
plot(ema_4, color=color.red, title="EMA 100")
// Entry Conditions
longCondition = ta.crossover(ema_1, ema_4) and ta.crossover(ema_2, ema_3) and rsi > 50 and macdLine > signalLine
shortCondition = ta.crossunder(ema_1, ema_4) and ta.crossunder(ema_2, ema_3) and rsi < 50 and macdLine < signalLine
// Declare Stop Loss and Take Profit Variables
var float stopLossPrice = na
var float takeProfitPrice = na
var line stopLossLine = na
var line takeProfitLine = na
// Long Trade
if (longCondition)
strategy.entry("Buy", strategy.long)
stopLossPrice := strategy.position_avg_price * (1 - stopLossPct)
takeProfitPrice := strategy.position_avg_price * (1 + takeProfitPct)
// stopLossLine := line.new(bar_index, stopLossPrice, bar_index + 1, stopLossPrice, color=color.red, width=2, style=line.style_dotted)
// takeProfitLine := line.new(bar_index, takeProfitPrice, bar_index + 1, takeProfitPrice, color=color.green, width=2, style=line.style_dotted)
// Short Trade
if (shortCondition)
strategy.entry("Sell", strategy.short)
stopLossPrice := strategy.position_avg_price * (1 + stopLossPct)
takeProfitPrice := strategy.position_avg_price * (1 - takeProfitPct)
// stopLossLine := line.new(bar_index, stopLossPrice, bar_index + 1, stopLossPrice, color=color.red, width=2, style=line.style_dotted)
// takeProfitLine := line.new(bar_index, takeProfitPrice, bar_index + 1, takeProfitPrice, color=color.green, width=2, style=line.style_dotted)
// Clear Lines on Trade Exit
// if (strategy.position_size == 0)
// line.delete(stopLossLine)
// line.delete(takeProfitLine)
// Exit Trades
if (strategy.position_size > 0)
strategy.exit("Sell", from_entry="Buy", stop=stopLossPrice, limit=takeProfitPrice)
if (strategy.position_size < 0)
strategy.exit("Cover", from_entry="Sell", stop=stopLossPrice, limit=takeProfitPrice)