다중 기간 이동 평균 및 RSI 모멘텀 크로스오버 추세 추적 전략

1
Follow
1781
Followers
개요
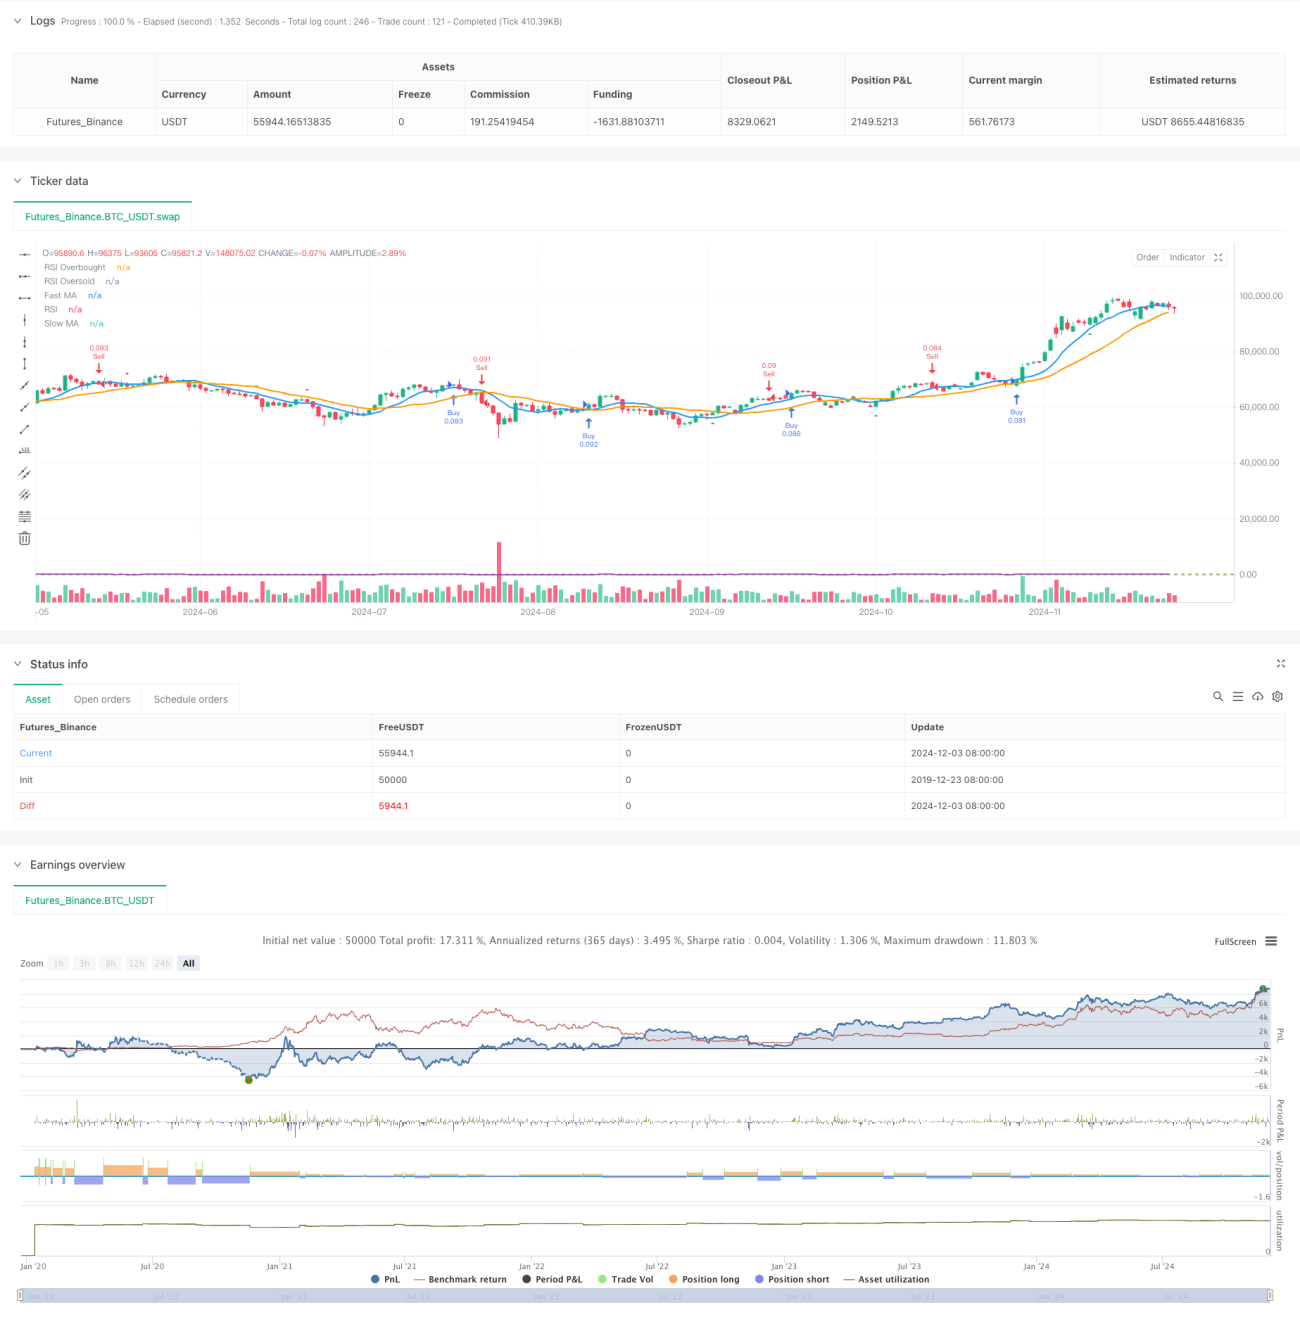
이 전략은 다중 주기 이동 평균, RSI 오버 바이 오버 세 신호와 가격 형태를 식별하는 통합 거래 시스템이다. 이 전략은 주로 빠른 이동 평균과 느린 이동 평균의 교차, RSI 지표의 오버 바이 오버 세 영역 판단, 그리고 부어, 부어 침수 형태를 통해 시장 추세 전환점을 포착하여 거래를 발생시킨다. 이 전략은 백분율 포지션 관리 방식을 채택하고, 매 거래마다 10%의 계좌 자금을 사용한다. 이 방법은 더 나은 위험 통제를 달성하는 데 도움이 된다.
전략 원칙
이 전략의 핵심 논리는 다음과 같은 핵심 요소에 기반합니다.
- 이동 평균 시스템: 9주기와 21주기의 간단한 이동 평균 ((SMA) 을 신속하고 느린 평균선으로 사용하여 평균선 교차로 트렌드 방향을 판단한다.
- RSI 동력 지표: 14주기의 RSI 지표를 사용하여 70을 초고 구매 수준으로 설정하고 30을 초고 판매 수준으로 설정하여 가격 동력을 확인합니다.
- 가격 형태 인식: 부진과 부진의 포식 형태를 프로그래밍 방식으로 인식하여 보조 거래 신호로 사용한다.
- 신호 종합: 구매 신호는 빠른 선에서 느린 선을 통과하고 RSI가 과매도 영역에 있거나, 또는 보수가 포용되는 형태를 나타냅니다. 판매 신호는 빠른 선 아래 느린 선을 통과하고 RSI가 초매도 영역에 있거나, 또는 보수가 포용되는 형태를 나타냅니다.
전략적 이점
- 다차원 신호 확인: 기술 지표와 가격 형태를 결합하여 신호 신뢰도를 높인다.
- 리스크 통제: 계좌의 비율을 보유하는 방식으로 거래 당 위험을 효과적으로 통제한다.
- 트렌드 추적 능력: 평균선 시스템을 통해 중·장기 트렌드를 효과적으로 포착할 수 있다.
- 신호 시각화: 전략은 명확한 그래픽 인터페이스를 제공하며, 평균선, RSI 지표 및 거래 신호 표시를 포함합니다.
- 유연한 변수 설정: 평균선 주기, RSI 변수 등을 조정하여 다른 시장 환경에 맞게 조정할 수 있다.
전략적 위험
- 흔들림 시장 위험: 가로판 흔들림 시장에서 빈번한 가짜 브레이크 신호가 발생할 수 있다.
- 뒤떨어진 위험: 이동 평균은 본질적으로 뒤떨어진 지표이며, 최고의 진입 시점을 놓칠 수 있다.
- 매개 변수 감수성: 다른 시장 환경에서 최적 매개 변수가 큰 차이가 있을 수 있다.
- 형태 인식 정확성: 프로그램화된 인식 형태는 실제 시장 형태와 오차가 있을 수 있다.
전략 최적화 방향
- 변동율 필터를 도입: 낮은 변동율 환경에서 거래 신호를 필터링하기 위해 ATR 지표를 추가하는 것이 좋습니다.
- 최적화된 스톱 메커니즘: ATR에 기반한 동적 스톱을 설정할 수 있으며, 위험 제어의 유연성을 높인다.
- 시장 환경 판단을 높여: 트렌드 강도 지표를 도입하여 다른 시장 환경에서 다른 파라미터 조합을 사용합니다.
- 포지션 관리: 신호 강도 및 시장 변동률에 따라 포지션 크기를 조정할 수 있다.
- 추가 시간 필터: 시장의 시간적 특성을 고려하여 특정 시간대에 거래하는 것을 피하십시오.
요약하다
이것은 합리적이고 논리적으로 명확하게 설계된 통합 기술 분석 거래 전략이다. 여러 기술 지표와 가격 형태를 결합함으로써, 전략은 신호 신뢰성을 보장하는 동시에, 또한 더 나은 위험 관리를 실현한다. 일부 고유 한 한계가 있지만, 제안 된 최적화 방향을 통해 전략의 전반적인 성능이 더 향상될 전망이다. 사용자는 실제 응용에서 파라미터 최적화 및 시장 환경에 적응하는 데 주의를 기울여야합니다. 최적의 거래 효과를 달성하기 위해.
Source
Pine
/*backtest
start: 2019-12-23 08:00:00
end: 2024-12-04 00:00:00
period: 1d
basePeriod: 1d
exchanges: [{"eid":"Futures_Binance","currency":"BTC_USDT"}]
*/

//@version=5
strategy("Comprehensive Trading Strategy", overlay=true, default_qty_type=strategy.percent_of_equity, default_qty_value=10)

// Input parameters for moving averagesStrategy parameters
Related strategies
Comment
All comments (0)
No data
- 1