
이 글은 여러 기술적 지표가 결합된 거래 전략 시스템을 소개한다. 이 시스템은 MACD, EMA, 간단한 이동 평균 및 MA100과 같은 여러 기술적 분석 방법을 통합하여 위험 관리 및 시간 필터와 함께 거래자에게 포괄적인 거래 솔루션을 제공하는 것을 목표로 한다.
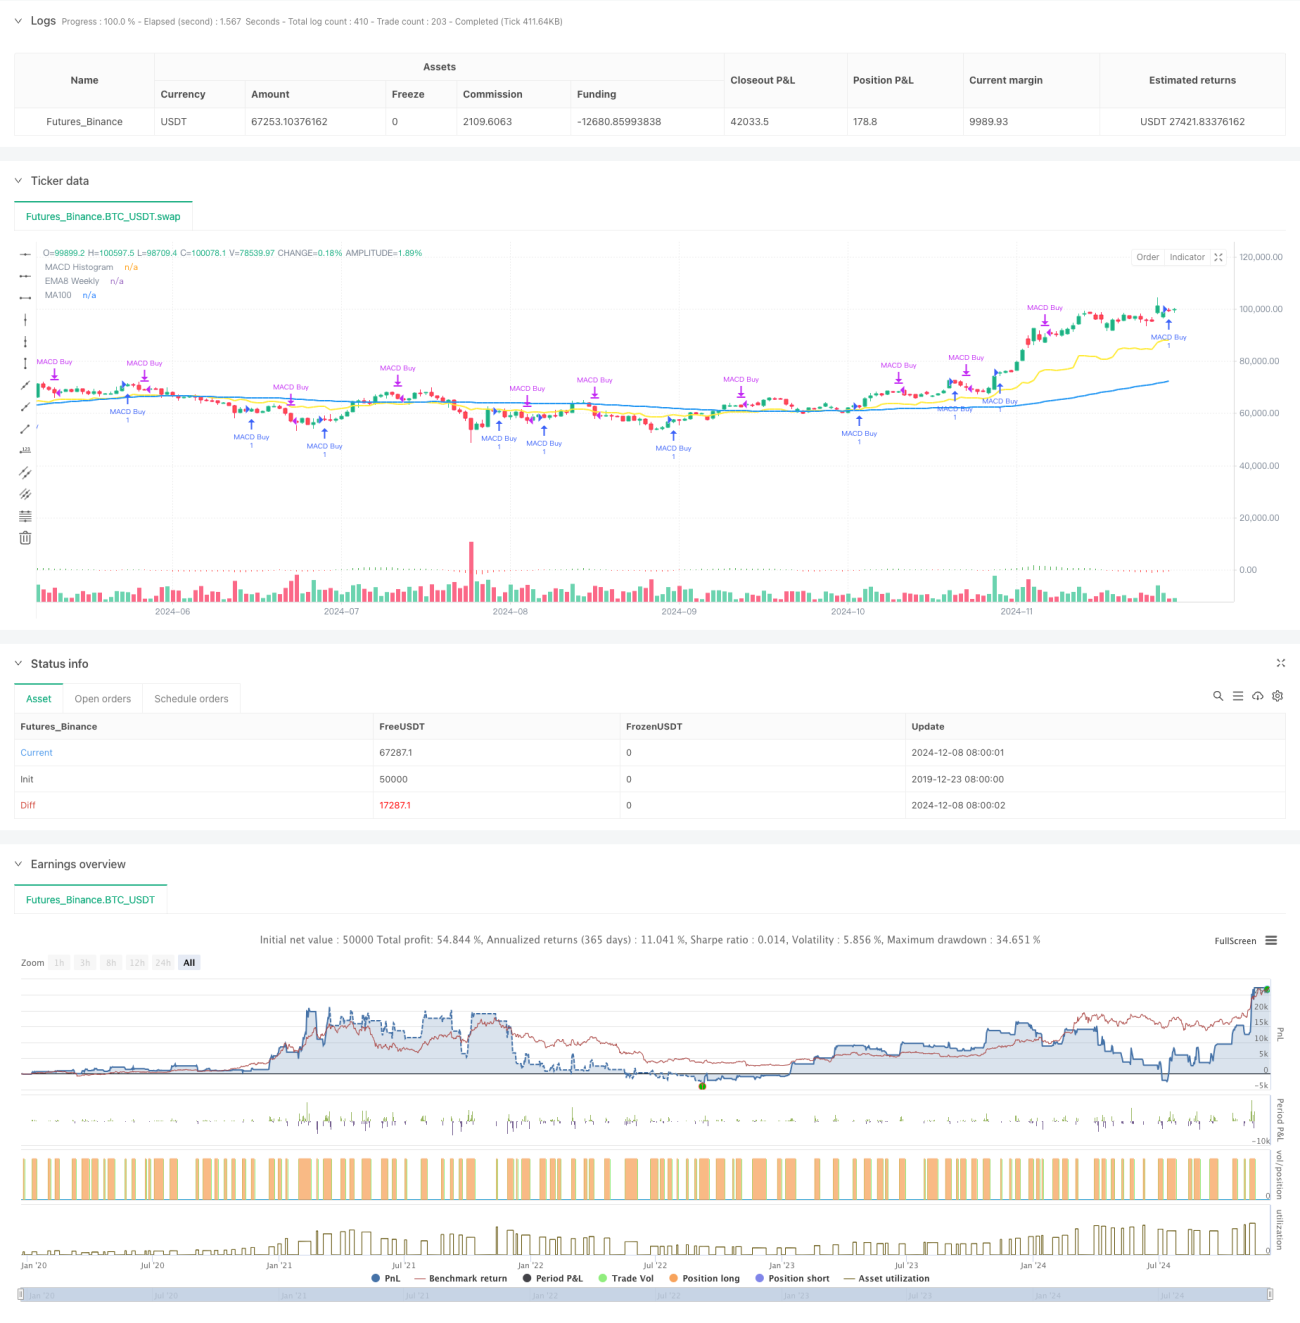
이 전략은 4개의 독립적인 하위 전략: MACD 전략, EMA8 전략, 간단한 MA 전략 및 MA100 전략으로 구성된 다중 전략 포트폴리오 기술 분석 시스템입니다. 시스템은 시장 상황에 따라 거래자가 다양한 유형의 전략을 선택할 수 있도록 허용합니다. 각 하위 전략은 고유한 입출금 논리를 가지고 있으며 그에 따른 위험 관리 장치가 있습니다.
MACD 전략: MACD 직각의 연속 상승과 하락 패턴을 식별하여 시장 동향을 포착한다. 세 개의 연속 상승 직각 기둥이 나타나면 구매 신호를 유발하고, 두 개의 연속 하락 직각 기둥이 판매 신호를 유발한다.
EMA8 전략: 둘레 EMA8 평균선, 전기 최고점, K선 형태 분석을 결합한 EMA8 전략. 가격이 둘레 EMA8을 뚫고 전기 최고점보다 높은 종결 가격과 동시에 강력한 K선이 나타나면 시스템이 구매한다. 이 전략은 2%의 중지 손실 설정을 갖추고 있다.
간단한 MA 전략: 복수의 지수 이동 평균을 사용하여 ((10,15,25,35,40 주기) 트렌드 추적 시스템을 구축하십시오. 더 짧은 주기 평균이 더 긴 주기 평균 위에 있고 가격이 가장 짧은 주기 평균을 돌파 할 때 구매 신호를 유발하십시오. 마찬가지로 2%의 스톱 손실을 설정하십시오.
MA100 전략: 100일 평균선, 8일 평균선 및 25일 평균선을 결합하고, 무작위 지표를 도입하여 과매매 판단한다. 단기 평균선이 장기 평균선 위에 있고, 가격이 MA100 근처에서 변동할 때, 시스템은 과매매 지역에서 구매 기회를 찾는다. 이 전략은 3%의 중지 손실 설정을 채택한다.
이 다중 전략 포트폴리오 기술 분석 거래 시스템은 여러 정식 기술 분석 방법을 통합하여 거래자에게 포괄적 인 거래 의사 결정 프레임 워크를 제공합니다. 시스템의 주요 장점은 유연성과 위험 제어 능력입니다. 그러나 동시에 거래자가 올바르게 사용하기 위해 시장에 대한 깊은 이해를 필요로합니다. 지속적인 최적화 및 개선으로 시스템은 더 완벽한 거래 도구가 될 것입니다.
/*backtest
start: 2019-12-23 08:00:00
end: 2024-12-09 08:00:00
period: 1d
basePeriod: 1d
exchanges: [{"eid":"Futures_Binance","currency":"BTC_USDT"}]
*/
// This Pine Script™ v5 code implements multiple trading strategies
//@version=5
strategy("Multi-Strategy Trading System", overlay=true)
// Input parameters for customization
strategy_type = input.string("MACD", "Strategy Type", options=["MACD", "EMA8", "SimpleMA", "MA100"])
show_macd = input.bool(true, "Show MACD Signals")
show_ema = input.bool(true, "Show EMA Signals")
show_ma = input.bool(true, "Show MA Signals")
// MACD Strategy Components
[macdLine, signalLine, histLine] = ta.macd(close, 12, 26, 9)
// Function to detect three consecutive ascending histogram bars
isThreeAscendingBars(hist) =>
not na(hist[3]) and hist[3] < hist[2] and hist[2] < hist[1] and hist[1] < hist[0]
// Function to detect two consecutive descending histogram bars
isTwoDescendingBars(hist) =>
not na(hist[2]) and hist[2] > hist[1] and hist[1] > hist[0]
// EMA Strategy Components
ema8_weekly = request.security(syminfo.tickerid, "W", ta.ema(close, 8))
weeklyHigh = request.security(syminfo.tickerid, "W", high)
previousWeekHigh = weeklyHigh[1]
isStrongCandleWeekly = request.security(syminfo.tickerid, "W", close > open and (close - open) > (high - low) * 0.6)
// Simple MA Strategy Components
ema10 = ta.ema(close, 10)
ema15 = ta.ema(close, 15)
ema25 = ta.ema(close, 25)
ema35 = ta.ema(close, 35)
ema40 = ta.ema(close, 40)
// MA100 Strategy Components
ma100 = ta.sma(close, 100)
ma8 = ta.sma(close, 8)
ma25 = ta.sma(close, 25)
// Corrected Stochastic Oscillator Calculation
stochK = ta.stoch(high, low, close, 14)
stochD = ta.sma(stochK, 3)
isOversold = stochK < 20 and stochD < 20
// MACD Strategy Logic
if strategy_type == "MACD"
// Buy condition: Three ascending histogram bars after lowest
if isThreeAscendingBars(histLine)
strategy.entry("MACD Buy", strategy.long)
// Sell condition: Two descending histogram bars after highest
if isTwoDescendingBars(histLine)
strategy.close("MACD Buy")
// EMA8 Strategy Logic
if strategy_type == "EMA8"
if close > ema8_weekly and close > previousWeekHigh and isStrongCandleWeekly
strategy.entry("EMA8 Buy", strategy.long)
strategy.exit("EMA8 Exit", "EMA8 Buy", stop=low - (low * 0.02))
// Simple MA Strategy Logic
if strategy_type == "SimpleMA"
isUptrend = ema10 > ema15 and ema15 > ema25 and ema25 > ema35 and ema35 > ema40
if isUptrend and close > ema10 and close[1] <= ema10[1]
strategy.entry("MA Buy", strategy.long)
strategy.exit("MA Exit", "MA Buy", stop=low - (low * 0.02))
// MA100 Strategy Logic
if strategy_type == "MA100"
isUptrend = ma8 > ma100 and ma25 > ma100
isPriceNearMA100 = math.abs(close - ma100) / ma100 * 100 < 1
if isUptrend and isPriceNearMA100 and isOversold
strategy.entry("MA100 Buy", strategy.long)
strategy.exit("MA100 Exit", "MA100 Buy", stop=low - (low * 0.03))
// Plotting components for visualization
plot(ma100, "MA100", color=color.blue, linewidth=2)
plot(ema8_weekly, "EMA8 Weekly", color=color.yellow, linewidth=2)
plot(series=histLine, title="MACD Histogram", style=plot.style_histogram, color=histLine > 0 ? color.green : color.red)