RSI-ATR 모멘텀 변동성 조합 거래 전략

1
Follow
1781
Followers
개요
이것은 RSI 동적 지표와 ATR 변동 지표가 결합된 거래 전략 시스템이다. 이 전략은 RSI와 이동 평균의 교차 상황을 모니터링하여 잠재적인 거래 기회를 식별하며 ATR 지표를 변동률 필터로 사용하여 시장이 충분한 변동성을 확보한다. 이 전략은 유럽 거래 시간 ((프라하 시간 8:00-21:00) 에서 작동하며 5 분 주기이며 고정된 중지 손실 수준을 설정한다.
전략 원칙
전략의 핵심 논리는 다음과 같은 핵심 구성 요소를 기반으로 합니다.
- RSI 지표는 오버 바이 오버 셀 지역을 식별하기 위해 사용되며, RSI가 45보다 낮으면 오버 세 지역으로 간주되며, 55보다 높으면 오버 바이 지역으로 간주됩니다.
- RSI와 이동 평균의 교차가 입문 신호의 촉발 조건으로
- ATR 지표는 낮은 변동률 환경을 필터링하기 위해 사용되며 ATR이 설정된 임계값보다 높을 때만 거래가 허용됩니다.
- 거래 시간은 프라하 시간 8:00-21:00 사이에 제한됩니다.
- 고정 스톱 스톱 손실 전략을 사용하여 5000 포인트로 기본 설정
구체적인 거래 규칙은 다음과 같습니다.
- 다중 조건: RSI가 45 이하의 이동 평균과 상향으로 교차하고 거래 시간 및 변동률 조건을 충족합니다.
- 공백 조건: RSI가 55 이상에서 이동 평균과 아래로 교차하며 거래 시간 및 변동률 조건을 충족합니다.
- 출구 조건: 스톱 포지션이나 스톱 로즈 포지션을 만지면 자동으로 평정
전략적 이점
- 다중 필터 메커니즘: 동력 지표 ((RSI) 와 변동률 지표 ((ATR) 를 결합하여 가짜 신호를 효과적으로 감소시킵니다.
- 시간 필터링: 거래 시간 창을 제한하여 유동성이 낮은 시기의 방해를 피합니다.
- 리스크 관리: 고정된 스톱 스톱 손실을 설정하여 자금 관리를 용이하게 합니다.
- 매개 변수 조정 가능: RSI 길이, ATR 절도 등과 같은 핵심 매개 변수는 시장 상황에 따라 최적화 할 수 있습니다.
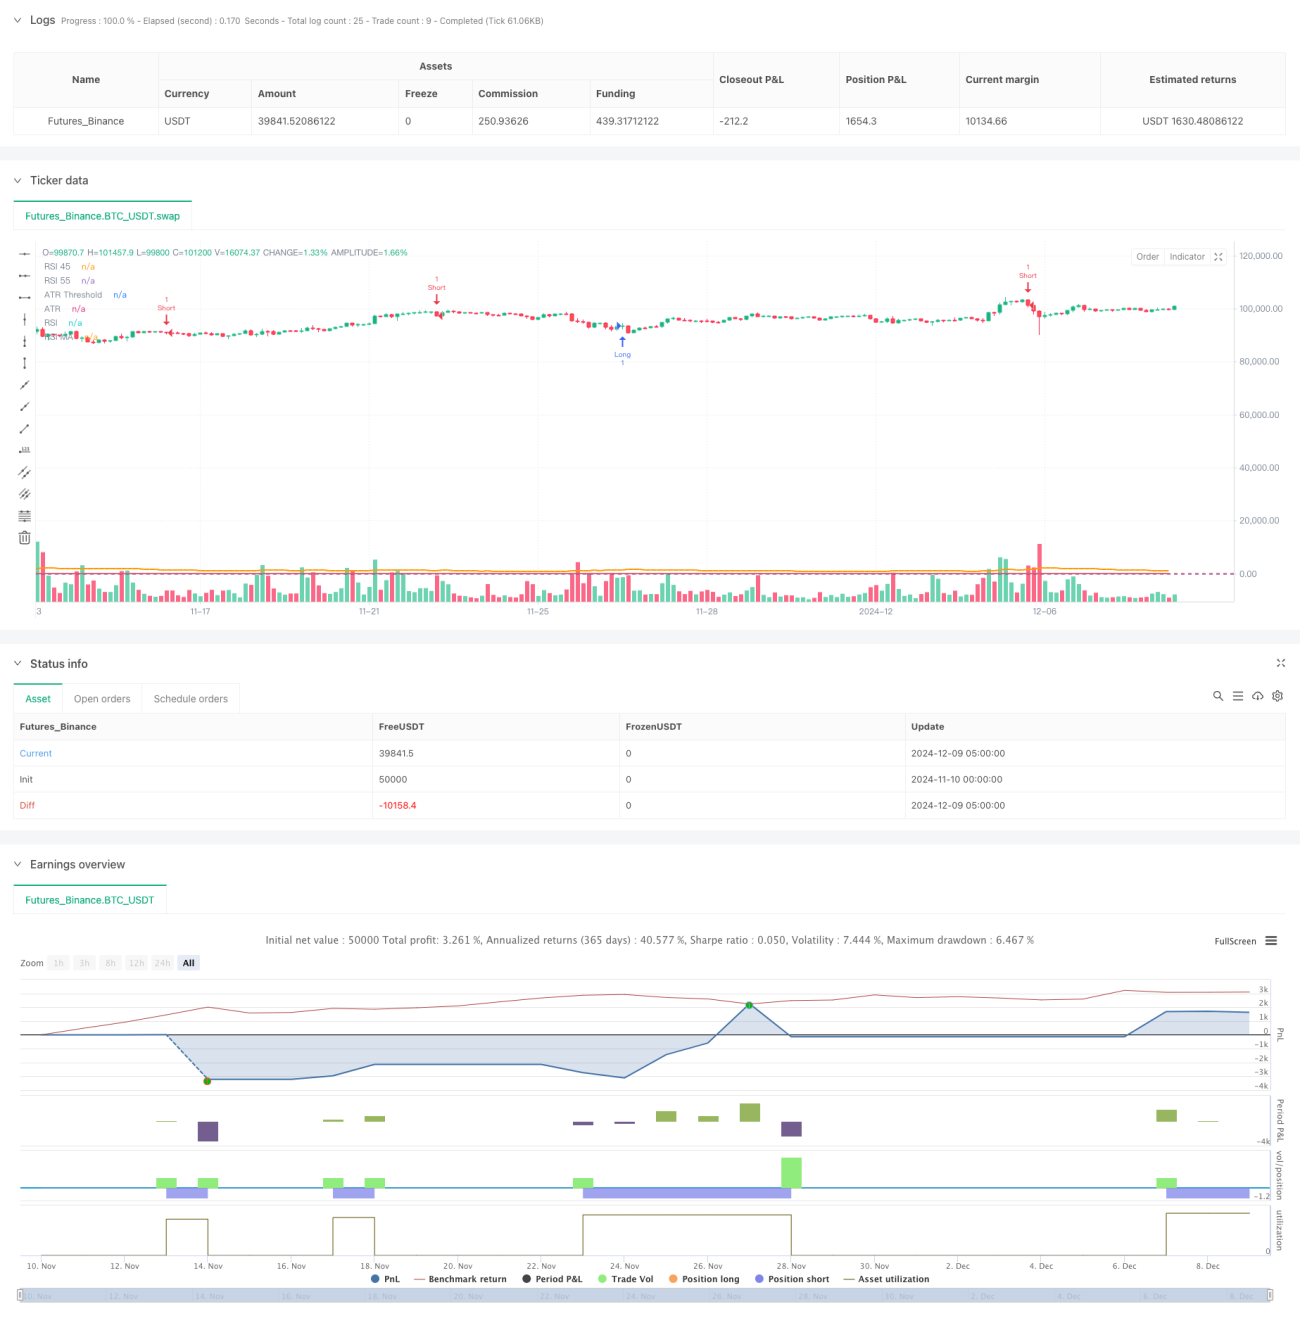
- 재검토 결과는 안정적이었습니다: 승률은 64.4%였고, 승률은 1.1이었다.
전략적 위험
- 고정 스톱 스톱 손실은 모든 시장 환경에 적합하지 않을 수 있으며, 급격한 변동성 기간에는 조기 출전을 유발할 수 있습니다.
- RSI 지표가 트렌드 시장에서 자주 잘못된 신호를 일으킬 수 있습니다.
- ATR 필터링은 전략적으로 중요한 시장 기회를 놓칠 수 있습니다.
- 시간 창 제한으로 인해 다른 시간대의 우수한 거래 기회를 놓칠 수 있습니다.
- 전략은 변수 최적화에 의존하며, 과도한 최적화는 과다 적합성의 위험을 초래할 수 있습니다.
전략 최적화 방향
- 동적 스톱 스톱: ATR 동적에 따라 스톱 스톱 스톱의 폭을 조정하여 시장의 변동에 더 잘 적응하도록 고려할 수 있습니다.
- 트렌드 필터: 이동 평균 시스템과 같은 트렌드 판단 지표를 추가하여 흔들리는 시장에서 잘못된 신호를 줄이십시오.
- 출전 시간 변경: 출전 품질을 높이기 위해 보조 확인으로 출전 수량 지표를 추가하는 것을 고려할 수 있습니다.
- 최적화 시간 창: 다양한 시장의 특성에 따라 거래 시간 창을 조정하여 더 많은 기회를 잡습니다.
- 자금 관리 모듈을 추가: 역동적인 포지션 규모 관리를 구현하여 위험을 더 잘 제어합니다.
요약하다
이 전략은 RSI와 ATR 지표를 결합하여 비교적 완전한 거래 시스템을 구축한다. 전략의 주요 장점은 여러 필터링 메커니즘과 완벽한 위험 관리이지만, 동시에 몇 가지 제한이 있습니다. 제안 된 최적화 방향에 의해 전략은 더 나은 성과를 얻을 수 있습니다. 핵심은 실제 거래 환경에 따라 계속 조정하고 최적화 매개 변수를 유지하여 전략의 적응성을 유지하는 것입니다.
Source
Pine
Strategy parameters
Related strategies
Comment
All comments (0)
No data
- 1