다중 기간 평활화 하이킨 아시 추세 추적 양적 거래 시스템

MTF TFS
생성 날짜: 2024-12-11 15:42:36 마지막으로 수정됨: 2024-12-11 15:42:36
복사: 0 클릭수: 455
avatar of ChaoZhang ChaoZhang
1
집중하다
1617
수행원

다중 기간 평활화 하이킨 아시 추세 추적 양적 거래 시스템

개요

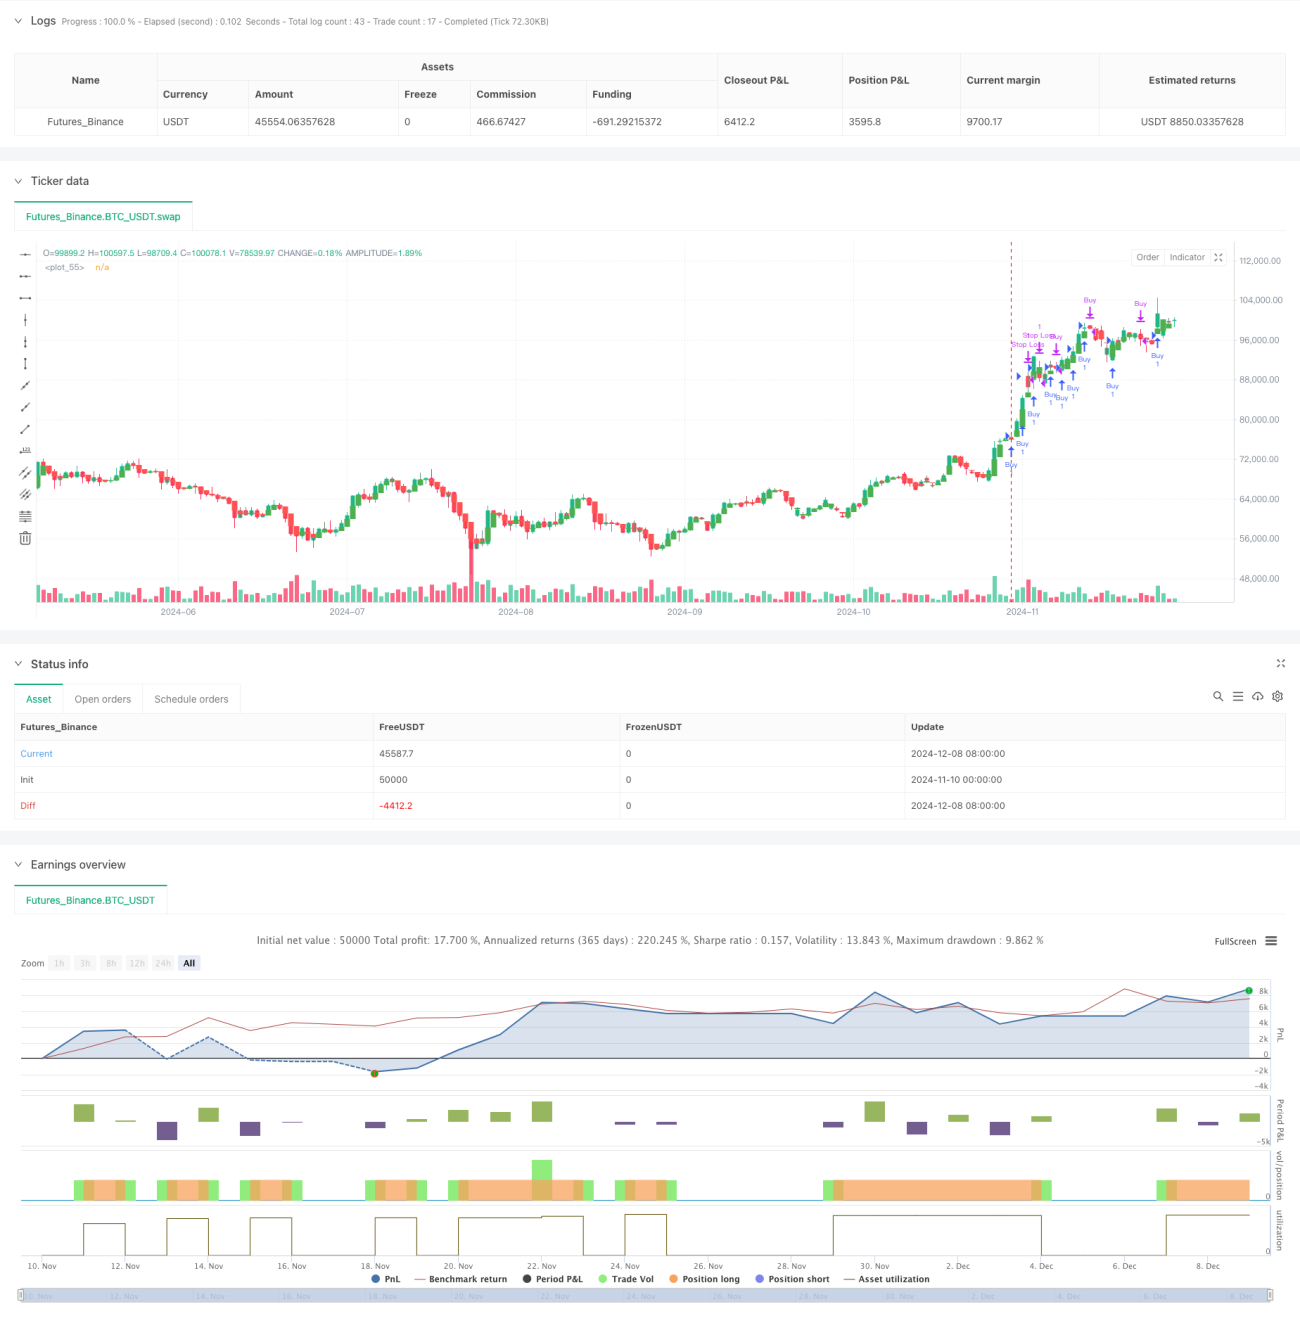
이 전략은 평평한 Heikin Ashi 도표를 기반으로 한 트렌드 추적 시스템이다. 높은 시간 주기에서 Heikin Ashi 도표를 계산하고 낮은 시간 주기 거래 결정에 적용함으로써 시장 소음의 영향을 효과적으로 줄인다. 이 전략은 유연한 거래 방향 선택, 단 하나, 단 하나 또는 양방향 거래를 제공하며, 손해 중지 기능을 통합하여 완전히 자동화 된 거래 프로세스를 구현한다.

전략 원칙

이 전략의 핵심 논리는 하이킨 아시 그래프의 고 시간 주기에서의 부드러운 특성을 활용하여 트렌드를 식별하는 것입니다. 하이킨 아시 그래프는 개시 가격과 폐시 가격에 대한 이동 평균을 계산하여 시장 소음을 효과적으로 필터링하여 주요 트렌드를 강조합니다. 녹색 이 나타나면 상승 추세를 나타냅니다.

전략적 이점

  1. 다주기 결합은 가짜 신호를 감소시킵니다: 더 높은 시간 주기에서 헤이킨 아시 지수를 계산함으로써 단기 파동으로 인한 간섭을 효과적으로 감소시킵니다.
  2. 리스크 관리가 완성된: 상쇄 기능이 통합되어 있으며, 시장의 변동에 따라 파라미터를 유연하게 조정할 수 있다.
  3. 방향 선택의 유연성: 시장의 특성에 따라 더 많이, 더 적게 또는 양방향으로 거래 할 수 있습니다.
  4. 완전 자동화 운영: 전략 논리가 명확하고, 매개 변수가 조정 가능하며, 자동화 거래에 적합하다.
  5. 적응력: 다양한 시장과 시간대에 적용할 수 있으며, 좋은 보편성을 가지고 있다.

전략적 위험

  1. 트렌드 반전 위험: 트렌드 반전 시 큰 회전이 발생할 수 있으며, 합리적인 스톱 로즈 설정이 필요합니다.
  2. 흔들리는 시장 위험: 가로판 흔들리는 시장에서 자주 거래하면 손실이 발생할 수 있다.
  3. 매개 변수 최적화 위험: 과도한 최적화는 전략이 실판에서 제대로 작동하지 않도록 만들 수 있다.
  4. 지점 비용 위험: 자주 거래하는 것은 높은 거래 비용을 초래할 수 있습니다.

전략 최적화 방향

  1. 트렌드 확인 지표를 추가: RSI 또는 MACD와 같은 다른 기술 지표를 보조 확인으로 도입 할 수 있습니다.
  2. 최적화된 중지 메커니즘: 추적 중지 또는 변동률에 기반한 동적 중단을 구현할 수 있다.
  3. 거래량 분석을 도입: 거래량 지표와 결합하여 입시 신호의 신뢰성을 높인다.
  4. 자기 적응 파라미터를 개발: 시장의 변동에 따라 자동으로 스톱 스 비율을 조정한다.
  5. 시간 필터를 추가: 거래가 활발하지 않은 시간에 자주 거래하지 마십시오.

요약하다

이 전략은 다주기 하이킨 아시 지표의 부드러운 특성을 통해 시장 추세를 효과적으로 포착하고, 완벽한 위험 관리 메커니즘을 통해 회전을 제어한다. 전략의 유연성과 확장성은 좋은 실용적 가치를 가지고 있으며, 지속적인 최적화와 개선을 통해 다양한 시장 환경에 적응할 수 있다. 특정 위험이 있지만, 합리적인 매개 변수 설정과 위험 관리를 통해 안정적인 거래 성능을 달성할 수 있다.

전략 소스 코드
/*backtest
start: 2024-11-10 00:00:00
end: 2024-12-09 08:00:00
period: 1d
basePeriod: 1d
exchanges: [{"eid":"Futures_Binance","currency":"BTC_USDT"}]
*/

//@version=5
strategy("Optimized Heikin Ashi Strategy with Buy/Sell Options", overlay=true)

// User inputs for customizing backtest settings
startDate = input(timestamp("2023-01-01 00:00"), title="Backtest Start Date", tooltip="Start date for the backtest")
endDate = input(timestamp("2024-01-01 00:00"), title="Backtest End Date", tooltip="End date for the backtest")

// Input for Heikin Ashi timeframe optimization
ha_timeframe = input.timeframe("D", title="Heikin Ashi Timeframe", tooltip="Choose the timeframe for Heikin Ashi candles")

// Inputs for optimizing stop loss and take profit
use_stop_loss = input.bool(true, title="Use Stop Loss")
stop_loss_percent = input.float(2.0, title="Stop Loss (%)", minval=0.0, tooltip="Set stop loss percentage")
use_take_profit = input.bool(true, title="Use Take Profit")
take_profit_percent = input.float(4.0, title="Take Profit (%)", minval=0.0, tooltip="Set take profit percentage")

// Input to choose Buy or Sell
trade_type = input.string("Buy Only", options=["Buy Only", "Sell Only"], title="Trade Type", tooltip="Choose whether to only Buy or only Sell")

// Heikin Ashi calculation on a user-defined timeframe
ha_open = request.security(syminfo.tickerid, ha_timeframe, ta.sma(open, 2), barmerge.gaps_off, barmerge.lookahead_on)
ha_close = request.security(syminfo.tickerid, ha_timeframe, ta.sma(close, 2), barmerge.gaps_off, barmerge.lookahead_on)
ha_high = request.security(syminfo.tickerid, ha_timeframe, math.max(high, close), barmerge.gaps_off, barmerge.lookahead_on)
ha_low = request.security(syminfo.tickerid, ha_timeframe, math.min(low, open), barmerge.gaps_off, barmerge.lookahead_on)

// Heikin Ashi candle colors
ha_bullish = ha_close > ha_open // Green candle
ha_bearish = ha_close < ha_open // Red candle

// Backtest period filter
inDateRange = true

// Trading logic depending on user input
if (inDateRange)  // Ensures trades happen only in the selected period
    if (trade_type == "Buy Only")  // Buy when green, Sell when red
        if (ha_bullish and strategy.position_size <= 0)  // Buy on green candle only if no position is open
            strategy.entry("Buy", strategy.long)
        if (ha_bearish and strategy.position_size > 0)  // Sell on red candle (close the long position)
            strategy.close("Buy")

    if (trade_type == "Sell Only")  // Sell when red, Exit sell when green
        if (ha_bearish and strategy.position_size >= 0)  // Sell on red candle only if no position is open
            strategy.entry("Sell", strategy.short)
        if (ha_bullish and strategy.position_size < 0)  // Exit the sell position on green candle
            strategy.close("Sell")

// Add Stop Loss and Take Profit conditions if enabled
if (use_stop_loss)
    strategy.exit("Stop Loss", from_entry="Buy", stop=strategy.position_avg_price * (1 - stop_loss_percent / 100))
    
if (use_take_profit)
    strategy.exit("Take Profit", from_entry="Buy", limit=strategy.position_avg_price * (1 + take_profit_percent / 100))

// Plot Heikin Ashi candles on the chart
plotcandle(ha_open, ha_high, ha_low, ha_close, color=ha_bullish ? color.green : color.red)