다중 이동 평균 추세 추종 거래 전략

1
Follow
1781
Followers
개요
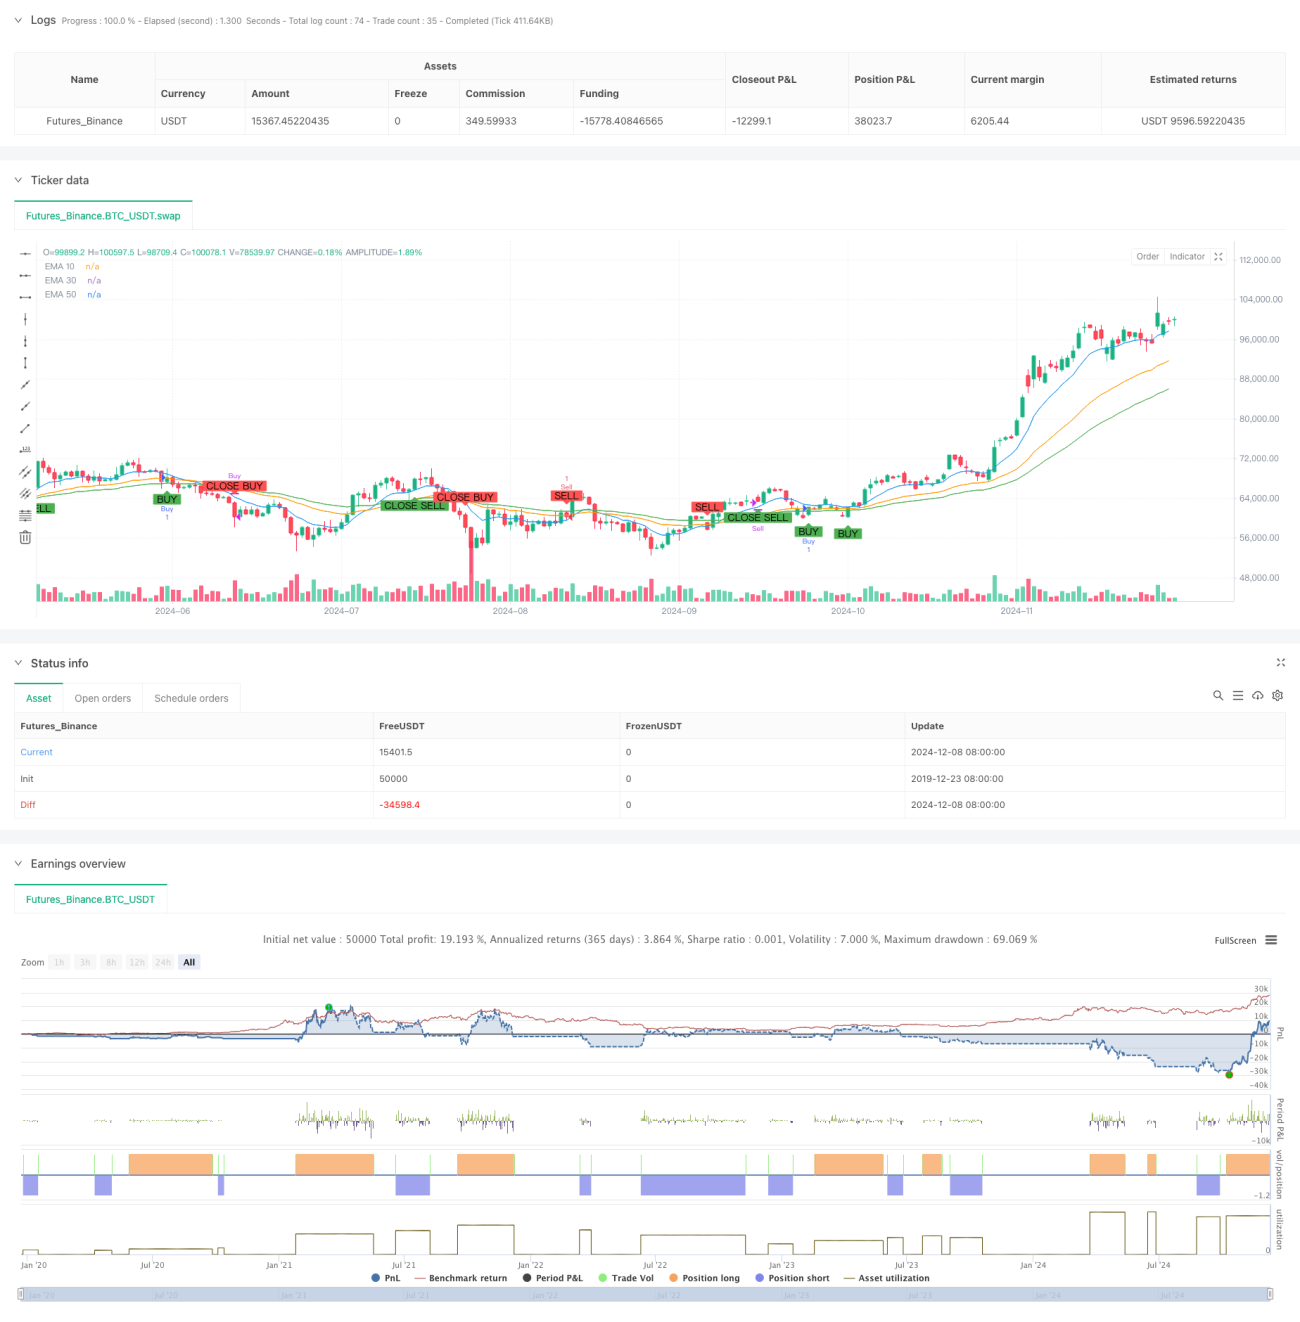
이 전략은 다중 지수 이동 평균 (EMA) 을 기반으로 한 트렌드 추적 거래 시스템입니다. 가격 통과와 트렌드 방향 판단과 결합하여 세 개의 다른 주기 (10, 30, 50) 의 EMA 라인을 사용하여 전체적인 구매 및 판매 신호 시스템을 구축합니다. 전략 설계는 트렌드의 형성, 확인 및 전환을 충분히 고려하여 시장의 주요 트렌드 기회를 효과적으로 포착 할 수 있습니다.
전략 원칙
전략은 거래 신호를 결정하기 위해 계층적 판단 메커니즘을 사용합니다.
- 트렌드 판단 계층: 세 개의 EMA ((10/30/50) 의 위치 관계를 사용하여 트렌드 방향을 판단한다. EMA10 > EMA30 > EMA50이 상승 추세로 판단되며, EMA50 > EMA30 > EMA10이 하락 추세로 판단된다.
- 신호 트리거 계층: 트렌드 확립에 기초하여 가격과 EMA30의 교차로 특정 거래 신호를 유발한다. 상향으로 EMA30을 통과하면 구매를 유발하고, 아래로 EMA30을 통과하면 판매를 유발한다.
- 평지 관리: EMA30과 EMA50이 역교차할 때, 대응 방향의 평지 신호를 유발한다. 이것은 체계적인 탈퇴 메커니즘을 제공한다.
전략적 이점
- 다중 확인 메커니즘: 여러 평선 선의 배열과 교차로로 다중 확인을 제공하여 가짜 신호 간섭을 줄인다.
- 트렌드 추적성: 주요 트렌드를 잘 파악하고, 단기 변동성을 효과적으로 필터링할 수 있다.
- 체계적: 입출장 조건이 명확하고 주관적인 판단에 영향을 받지 않습니다.
- 잘 적응: EMA 매개 변수를 조정하여 다른 시장 환경에 적응 할 수 있습니다.
- 위험 통제 합리적인: 트렌드 회전 신호를 통해 적시에 손실을 멈추고 위험을 통제한다.
전략적 위험
- 이변 위험: 시장의 변동이 있을 때 빈번하게 잘못된 신호가 발생하여 연속적인 손실을 초래할 수 있다.
- 뒤떨어진 위험: 평행선 시스템은 다소 뒤떨어져 있으며, 트렌드 초기에 중요한 가격 기회를 놓칠 수 있습니다.
- 폭파 위험: 급격한 변동이 있을 때 폭파 구멍이 커져서 전략에 영향을 미칠 수 있다.
- 매개변수 민감도: 매개변수 조합이 다르면 전략 성과에 큰 차이가 생길 수 있습니다.
전략 최적화 방향
- 변동성 지표 도입: ATR과 같은 변동성 지표를 추가하여 포지션 크기를 동적으로 조정하여 자금 사용 효율을 높이는 것이 좋습니다.
- 최적화 신호 필터링: 교통량, 동력 등 보조 지표를 증가시켜 가짜 신호를 필터링할 수 있다.
- 손해 방지 제도를 개선한다. 손해 추적 기능이 추가되어 더 나은 수익을 보호할 수 있다.
- 시간 필터를 추가: 거래 시간 제한을 추가하여 큰 변동성을 피할 수 있습니다.
- 매개 변수 적응: 시장 상태의 동력에 따라 EMA 매개 변수를 조정하는 적응 메커니즘을 도입하는 것을 고려하십시오.
요약하다
이것은 합리적이고, 논리적으로 명확한 트렌드 추적 전략이다. 다중 평균의 조합 사용으로 전략의 안정성을 보장하고 명확한 거래 신호를 제공합니다. 약간의 지연 위험이 있지만, 합리적인 최적화 및 위험 제어 조치를 통해 전략 전체는 더 나은 실용적 가치를 보여줍니다.
Source
Pine
Strategy parameters
Related strategies
Comment
All comments (0)
No data
- 1