
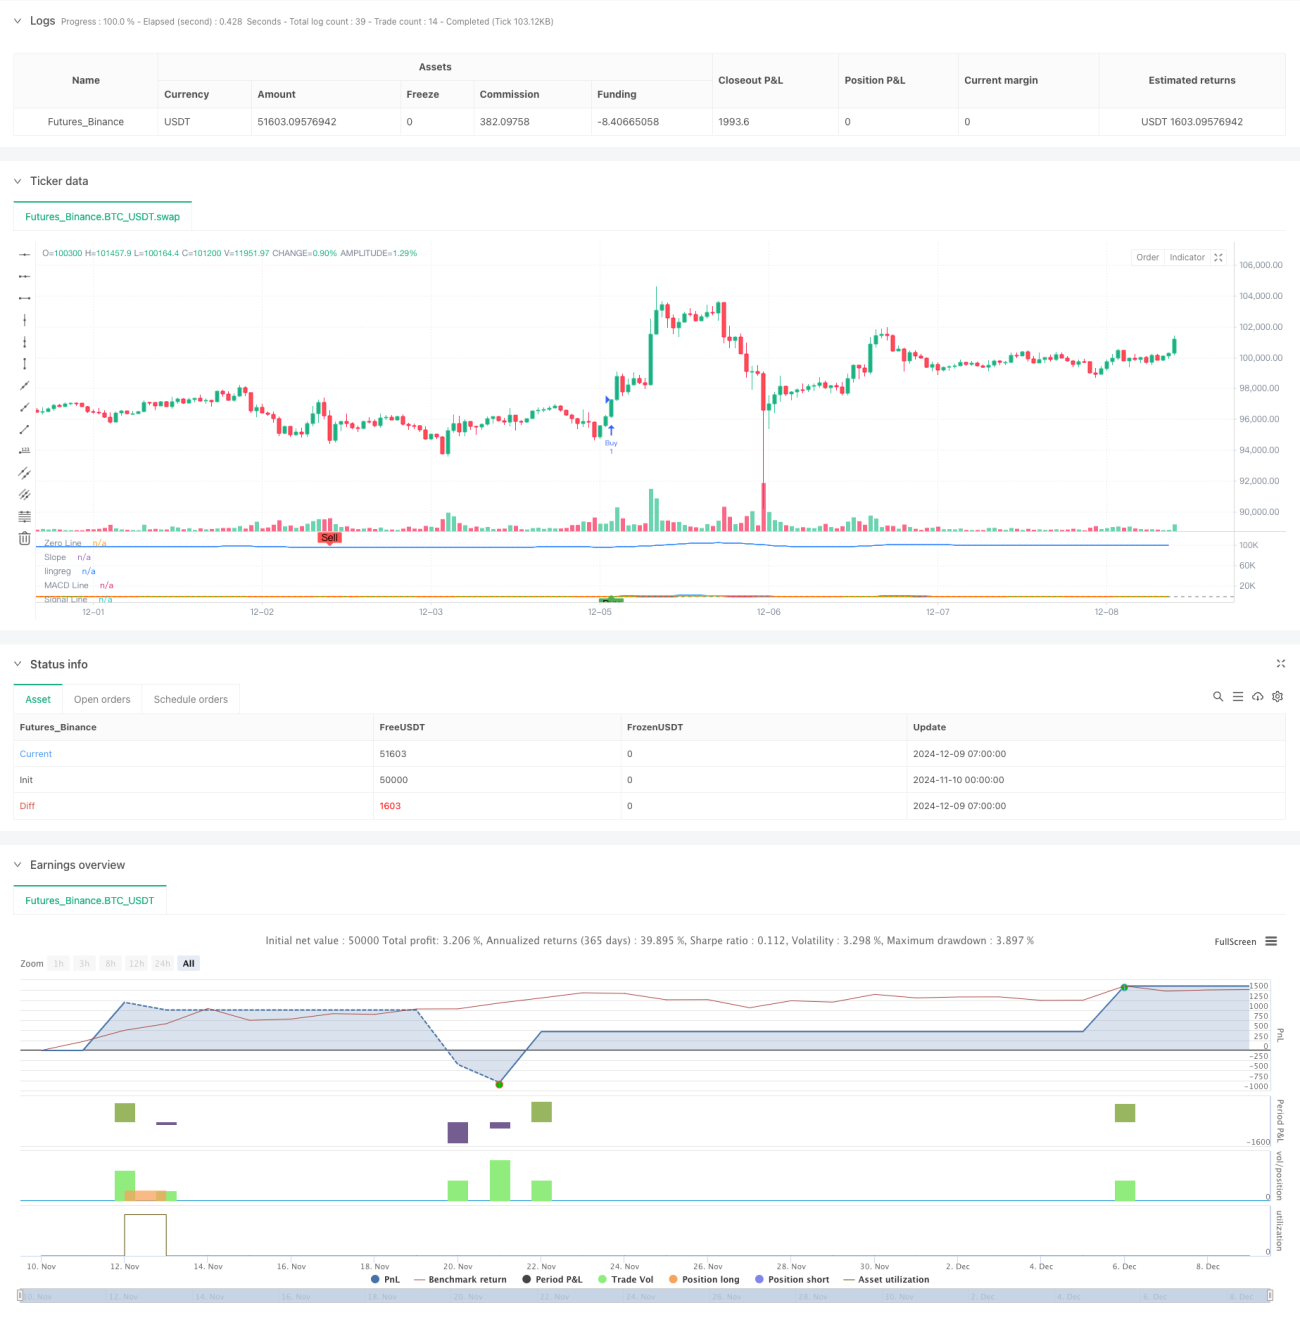
이 전략은 MACD ((이동 평균 수렴 분산 지표) 와 선형 회귀 기울기 ((LRS) 를 결합한 지능형 거래 시스템이다. 이 전략은 여러 가지 이동 평균 방법을 조합하여 MACD 지표의 계산을 최적화하고, 거래 신호의 신뢰성을 강화하기 위해 선형 회귀 분석을 도입한다. 이 전략은 거래자가 단일 지표 또는 쌍 지표 조합을 사용하여 거래 신호를 생성하는 것을 선택할 수 있도록 유연하게 허용하며, 위험을 제어하기 위해 스톱 손실 메커니즘을 갖추고 있다.
전략의 핵심은 최적화된 MACD와 선형 회귀 지표를 통해 시장의 추세를 포착하는 것이다. MACD 부분은 SMA, EMA, WMA, TEMA의 4가지 이동 평균 방법을 조합하여 가격 추세에 대한 감수성을 강화한다. 선형 회귀 부분은 회귀 선의 기울기와 위치를 계산하여 트렌드 방향과 강도를 판단한다. 구매 신호는 MACD의 금색 선형 회귀의 상승 추세 또는 두 가지의 조합을 기반으로 확인할 수 있다. 마찬가지로, 판매 신호는 유연하게 구성될 수 있다.
이 전략은 고전적 지표의 개선된 버전과 통계학적 방법을 결합하여 유연성과 신뢰성을 겸비한 거래 시스템을 만듭니다. 모듈화된 디자인은 거래자가 다양한 시장 환경에 따라 전략 매개 변수와 신호 확인 메커니즘을 유연하게 조정할 수 있도록합니다. 지속적인 최적화와 개선으로 이 전략은 다양한 시장 환경에서 안정적인 성능을 유지할 것으로 예상됩니다.
/*backtest
start: 2024-11-10 00:00:00
end: 2024-12-09 08:00:00
period: 1h
basePeriod: 1h
exchanges: [{"eid":"Futures_Binance","currency":"BTC_USDT"}]
*/
//@version=6
strategy('SIMPLIFIED MACD & LRS Backtest by NHBProd', overlay=false)
// Function to calculate TEMA (Triple Exponential Moving Average)
tema(src, length) =>
ema1 = ta.ema(src, length)
ema2 = ta.ema(ema1, length)
ema3 = ta.ema(ema2, length)
3 * (ema1 - ema2) + ema3
// MACD Calculation Function
macdfx(src, fast_length, slow_length, signal_length, method) =>
fast_ma = method == 'SMA' ? ta.sma(src, fast_length) :
method == 'EMA' ? ta.ema(src, fast_length) :
method == 'WMA' ? ta.wma(src, fast_length) :
tema(src, fast_length)
slow_ma = method == 'SMA' ? ta.sma(src, slow_length) :
method == 'EMA' ? ta.ema(src, slow_length) :
method == 'WMA' ? ta.wma(src, slow_length) :
tema(src, slow_length)
macd = fast_ma - slow_ma
signal = method == 'SMA' ? ta.sma(macd, signal_length) :
method == 'EMA' ? ta.ema(macd, signal_length) :
method == 'WMA' ? ta.wma(macd, signal_length) :
tema(macd, signal_length)
hist = macd - signal
[macd, signal, hist]
// MACD Inputs
useMACD = input(true, title="Use MACD for Signals")
src = input(close, title="MACD Source")
fastp = input(12, title="MACD Fast Length")
slowp = input(26, title="MACD Slow Length")
signalp = input(9, title="MACD Signal Length")
macdMethod = input.string('EMA', title='MACD Method', options=['EMA', 'SMA', 'WMA', 'TEMA'])
// MACD Calculation
[macd, signal, hist] = macdfx(src, fastp, slowp, signalp, macdMethod)
// Linear Regression Inputs
useLR = input(true, title="Use Linear Regression for Signals")
lrLength = input(24, title="Linear Regression Length")
lrSource = input(close, title="Linear Regression Source")
lrSignalSelector = input.string('Rising Linear', title='Signal Selector', options=['Price Above Linear', 'Rising Linear', 'Both'])
// Linear Regression Calculation
linReg = ta.linreg(lrSource, lrLength, 0)
linRegPrev = ta.linreg(lrSource, lrLength, 1)
slope = linReg - linRegPrev
// Linear Regression Buy Signal
lrBuySignal = lrSignalSelector == 'Price Above Linear' ? (close > linReg) :
lrSignalSelector == 'Rising Linear' ? (slope > 0 and slope > slope[1]) :
lrSignalSelector == 'Both' ? (close > linReg and slope > 0) : false
// MACD Crossover Signals
macdCrossover = ta.crossover(macd, signal)
// Buy Signals based on user choices
macdSignal = useMACD and macdCrossover
lrSignal = useLR and lrBuySignal
// Buy condition: Use AND condition if both are selected, OR condition if only one is selected
buySignal = (useMACD and useLR) ? (macdSignal and lrSignal) : (macdSignal or lrSignal)
// Plot MACD
hline(0, title="Zero Line", color=color.gray)
plot(macd, color=color.blue, title="MACD Line", linewidth=2)
plot(signal, color=color.orange, title="Signal Line", linewidth=2)
plot(hist, color=hist >= 0 ? color.green : color.red, style=plot.style_columns, title="MACD Histogram")
// Plot Linear Regression Line and Slope
plot(slope, color=slope > 0 ? color.purple : color.red, title="Slope", linewidth=2)
plot(linReg,title="lingreg")
// Signal Plot for Visualization
plotshape(buySignal, style=shape.labelup, location=location.bottom, color=color.new(color.green, 0), title="Buy Signal", text="Buy")
// Sell Signals for Exiting Long Positions
macdCrossunder = ta.crossunder(macd, signal) // MACD Crossunder for Sell Signal
lrSellSignal = lrSignalSelector == 'Price Above Linear' ? (close < linReg) :
lrSignalSelector == 'Rising Linear' ? (slope < 0 and slope < slope[1]) :
lrSignalSelector == 'Both' ? (close < linReg and slope < 0) : false
// User Input for Exit Signals: Select indicators to use for exiting trades
useMACDSell = input(true, title="Use MACD for Exit Signals")
useLRSell = input(true, title="Use Linear Regression for Exit Signals")
// Sell condition: Use AND condition if both are selected to trigger a sell at the same time, OR condition if only one is selected
sellSignal = (useMACDSell and useLRSell) ? (macdCrossunder and lrSellSignal) :
(useMACDSell ? macdCrossunder : false) or
(useLRSell ? lrSellSignal : false)
// Plot Sell Signals for Visualization (for exits, not short trades)
plotshape(sellSignal, style=shape.labeldown, location=location.top, color=color.new(color.red, 0), title="Sell Signal", text="Sell")
// Alerts
alertcondition(buySignal, title="Buy Signal", message="Buy signal detected!")
alertcondition(sellSignal, title="Sell Signal", message="Sell signal detected!")
// Take Profit and Stop Loss Inputs
takeProfit = input.float(10.0, title="Take Profit (%)") // Take Profit in percentage
stopLoss = input.float(0.10, title="Stop Loss (%)") // Stop Loss in percentage
// Backtest Date Range
startDate = input(timestamp("2024-01-01 00:00"), title="Start Date")
endDate = input(timestamp("2025-12-12 00:00"), title="End Date")
inBacktestPeriod = true
// Entry Rules (Only Long Entries)
if (buySignal and inBacktestPeriod)
strategy.entry("Buy", strategy.long)
// Exit Rules (Only for Long Positions)
strategy.exit("Exit Buy", from_entry="Buy", limit=close * (1 + takeProfit / 100), stop=close * (1 - stopLoss / 100))
// Exit Long Position Based on Sell Signals
if (sellSignal and inBacktestPeriod)
strategy.close("Buy", comment="Exit Signal")