
1
Follow
1781
Followers
개요
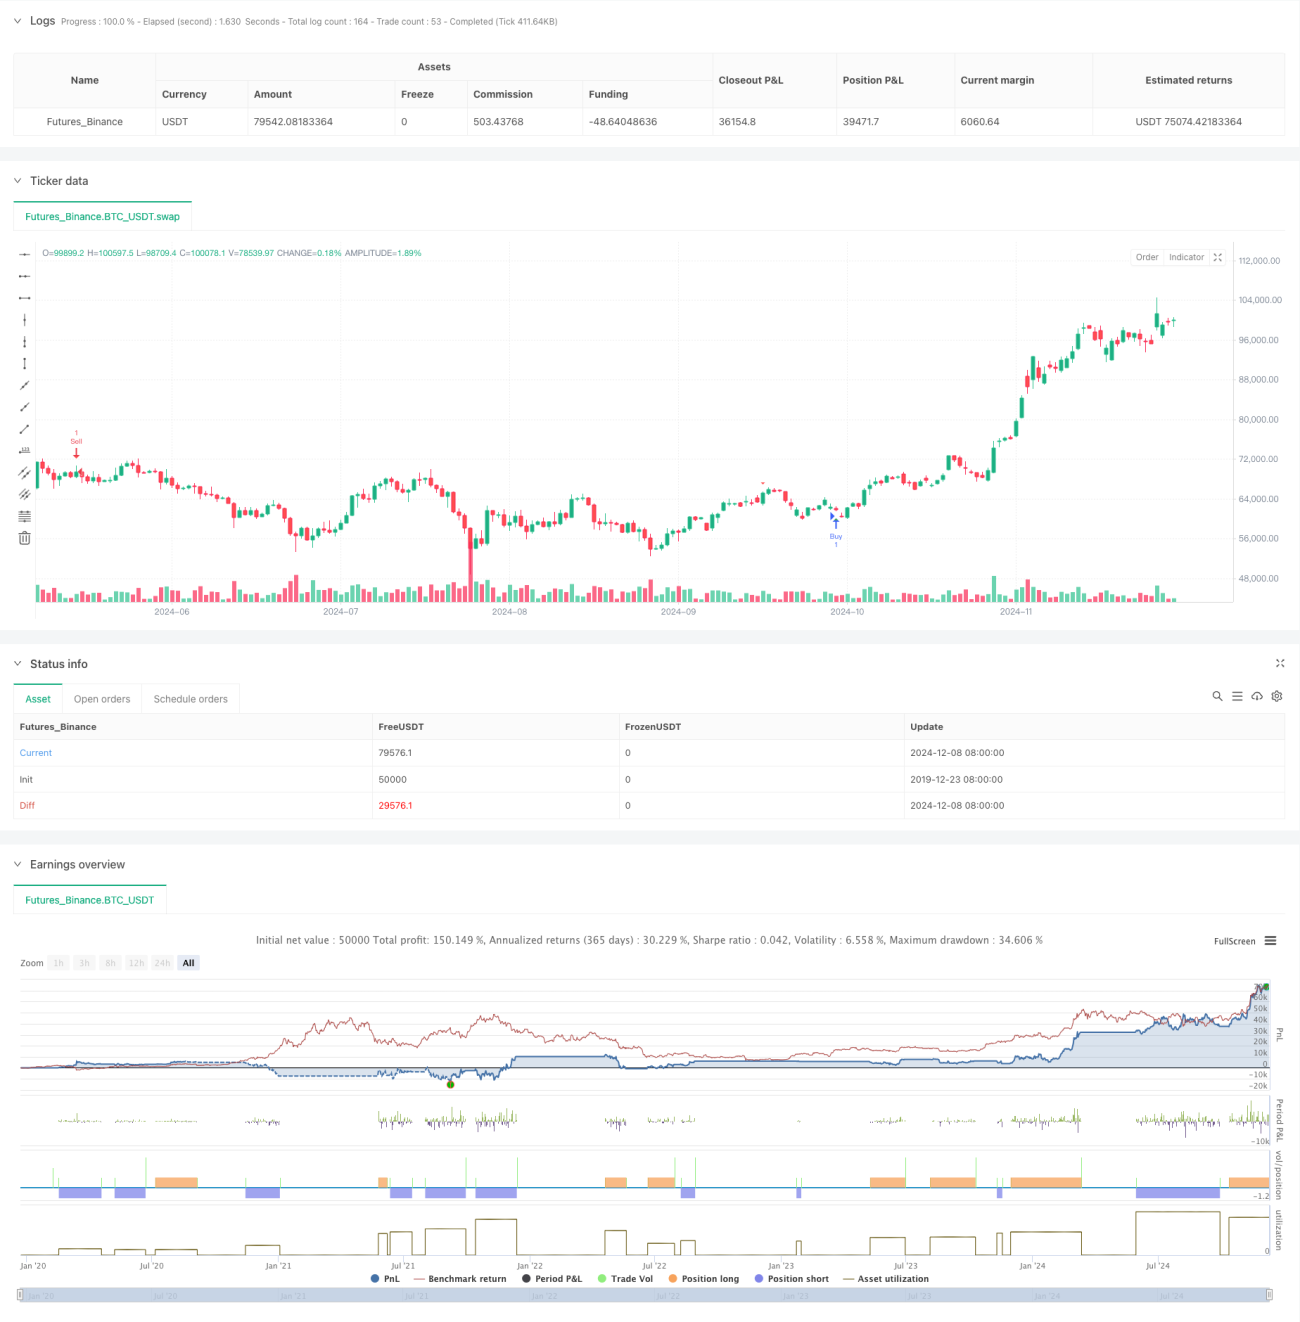
이 전략은 가속된 흔들림 지표 ((AC) 와 무작위 지표 ((Stochastic) 를 결합한 정량 거래 시스템이다. 가격과 기술 지표 사이의 오차를 식별하여 시장 동력의 전환을 포착하여 잠재적인 트렌드 반전을 예측한다. 이 전략은 또한 평행 (SMA) 와 상대적으로 약한 지표 (RSI) 를 통합하여 신호의 신뢰성을 높이고, 위험을 제어하기 위해 고정된 스톱포드를 설정한다.
전략 원칙
전략의 핵심 논리는 여러 기술 지표의 협동조합을 기반으로 한다. 우선 가속 진동 지표 ((AC) 를 계산한다. 이는 가격 중도값의 5주기 및 34주기 평균선 차이와 N주기 평균선을 <unk>어 얻는 것이다. 동시에 가격 혁신이 낮아 AC 지표가 높을 때, 낙관적 낙관성이 형성된다. 가격 혁신이 높아 AC 지표가 낮아 AC 지표가 낮아 낙관적 낙관성이 형성된다. 탈퇴 전략은 또한 RSI를 보조 확인 지표로 도입하여 여러 지표의 교차 검증을 통해 신호의 정확성을 높인다.
전략적 이점
- 다중 지표 연동: AC, Stochastic 및 RSI의 3가지 지표의 조합을 통해 거짓 신호를 효과적으로 필터링할 수 있다.
- 자동화된 리스크 컨트롤: 고정된 점수를 가진 스톱 스톱 손실 설정을 내장하여 거래 당 위험을 효과적으로 제어할 수 있습니다.
- 시각적 팁: 거래자가 기회를 빠르게 식별할 수 있도록 차트에 명확하게 표시된 거래 신호
- 유연성: 다양한 시장 환경과 거래 사이클에 적합한 변수 조정성
- 실시간 알림: 실시간 알림 시스템을 통합하여 거래 기회를 놓치지 않도록 합니다.
전략적 위험
- 가짜 브레이크 위험: 흔들리는 시장에서 가짜 반향 신호를 생성할 수 있다.
- 슬라이드 포인트 위험: 고정 점 수를 사용하여 스톱 스톱 손실로 인해 시장의 급격한 변동에 따라 큰 슬라이드 포인트가 발생할 수 있습니다.
- 매개변수 민감도: 매개변수 조합이 다양하면 전략 성능에 큰 차이가 생길 수 있습니다.
- 시장 환경 의존성: 추세가 보이지 않는 시장에서 전략의 효과는 떨어질 수 있습니다.
- 신호 지연성: 평균선 계산을 사용하기 때문에 신호가 다소 지연될 수 있다.
전략 최적화 방향
- 동적 스톱 스톱 손실: 시장의 변동에 따라 동적으로 조정할 수 있는 스톱 스톱 손실 지점
- 거래량 지표 도입: 거래량 확인을 통해 신호 신뢰성을 강화
- 시장 환경 필터링: 트렌드 판단 모듈을 추가하여 다른 시장 환경에서 다른 거래 전략을 사용합니다.
- 최적화 변수 선택: 기계 학습 방법을 사용하여 각 지표 변수 조합을 최적화
- 시간 필터링: 시장 시간 특성을 고려하여 불리한 시간에 거래하는 것을 피하십시오.
요약하다
이 전략의 장점은 여러 지표의 교차 검증과 완벽한 위험 제어 시스템이지만, 가짜 돌파구 및 변수 최적화와 같은 문제에 주의를 기울여야 합니다. 지속적인 최적화 및 개선으로 이 전략은 다양한 시장 환경에서 안정적인 성능을 유지할 것으로 예상됩니다.
Source
Pine
Strategy parameters
Related strategies
Comment
All comments (0)
No data
- 1