개요
이 전략은 지수 이동 평균 (EMA) 과 동력 지표에 기반한 트렌드 추적 전략이다. 동력 돌파 신호와 EMA 트렌드 필터를 결합한 방식으로 시장 추세가 명확할 때 거래한다. 전략은 전체적인 위험 관리 모듈, 유연한 거래 시간 필터, 그리고 세부적인 통계 분석 기능을 포함해 전략의 안정성과 신뢰성을 높인다.
전략 원칙
전략의 핵심 논리는 다음과 같은 핵심 요소에 기초합니다.
- 동력 신호 인식: 사용자 정의 시간 주기 내의 동력 값을 계산하여 동력이 상行값을 돌파할 때 다중 신호를 생성하고, 하行값을 돌파할 때 공백 신호를 생성한다.
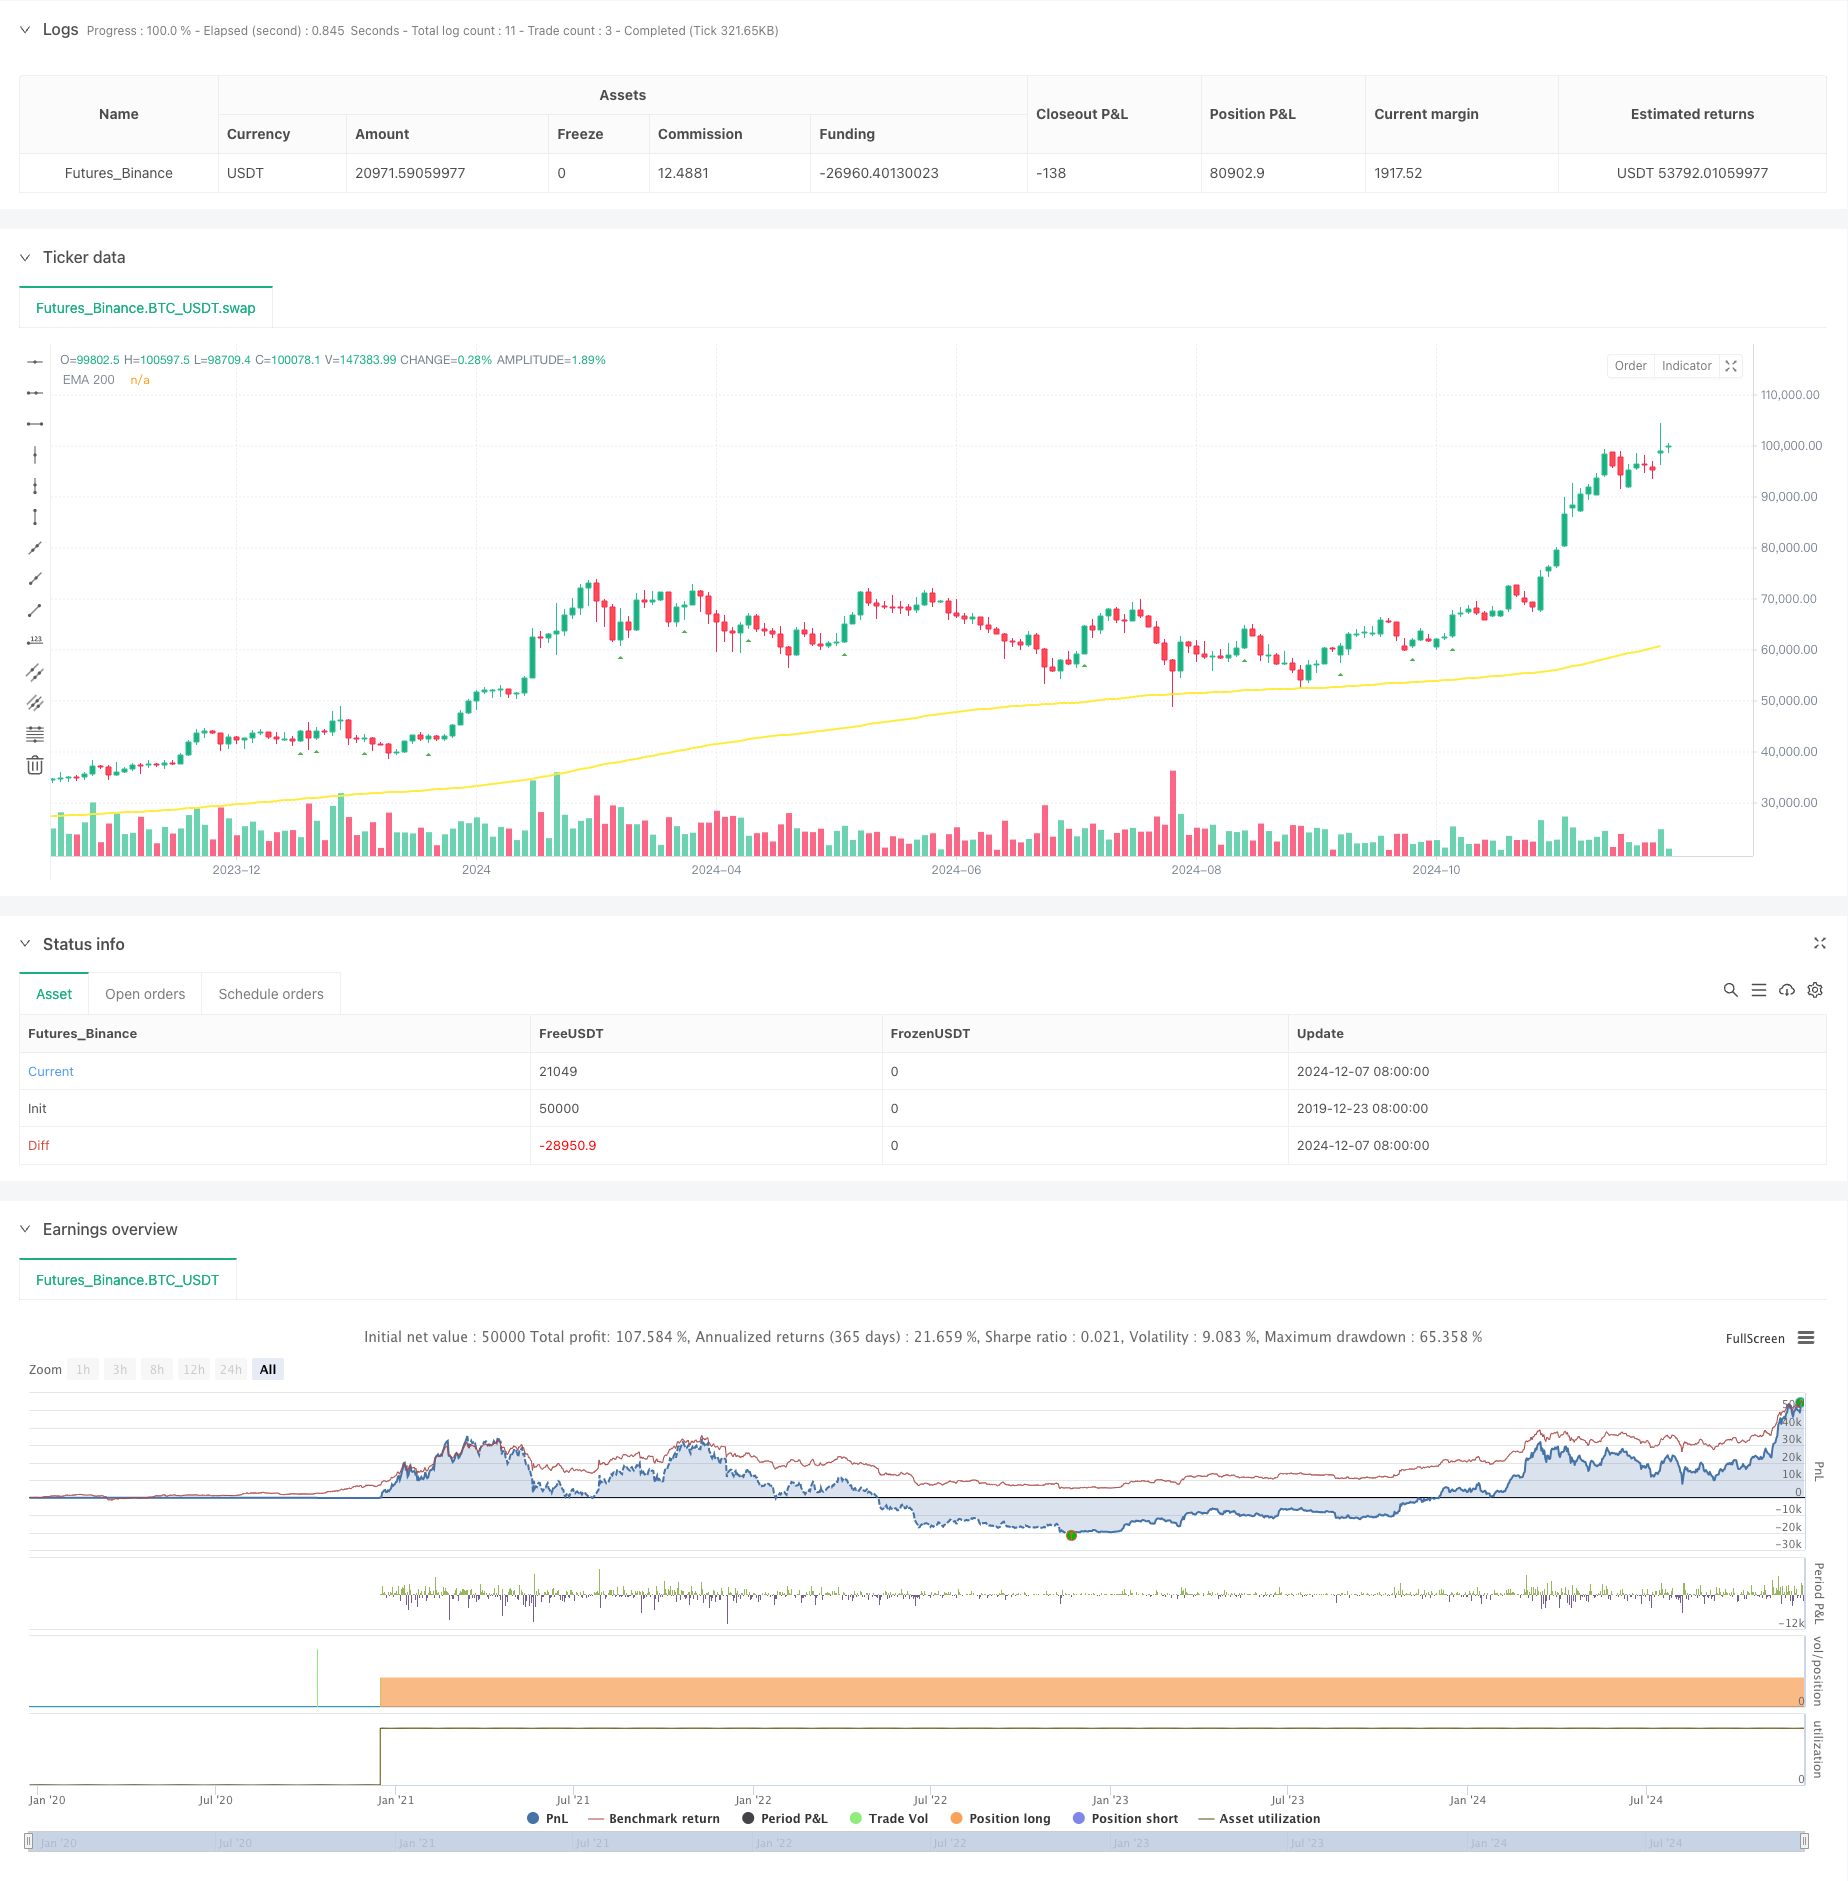
- EMA 트렌드 필터: 200주기 EMA를 트렌드 판단기준으로 사용하여, 가격은 EMA 위에 더 많이 할 수 있고, 가격은 EMA 아래에 더 많이 할 수 있다.
- 시간 필터: 특정 거래 시간을 설정할 수 있으며 GMT 시간대를 조정하여 전략이 다른 시장의 거래 시간에 더 잘 적응하도록 지원합니다.
- 위험 제어: ATR 또는 고정 비율에 기반한 중지 및 중지 설정을 지원하고 하루 최대 거래 수를 제한한다.
전략적 이점
- 트렌드 추적 능력: EMA와 동력의 이중 확인을 통해 주요 트렌드 상황을 효과적으로 포착할 수 있다.
- 리스크 관리: ATR 동적 중지 또는 고정 비율 중지와 같은 여러 종류의 중지 옵션을 제공합니다.
- 통계 분석 포괄적: 다중 승률, 위험/수익비 등과 같은 여러 성능 지표를 실시간으로 추적한다.
- 매개 변수 유연성: 주요 매개 변수는 시장 특성에 따라 최적화 조정할 수 있다.
전략적 위험
변동 시장 위험: 변동 시장에서 빈번한 가짜 브레이크 신호가 발생할 수 있다. 제안된 해결책: 충격 지표 필터를 추가하거나 돌파점 임계값을 높여라.
슬라이드 위험: 급격한 변동이 있을 때 더 큰 슬라이드 위험에 직면할 수 있다. 제안된 해결책: 합리적인 스톱 라인지를 설정하고, 높은 변동의 시간에 거래하는 것을 피하십시오.
과도한 거래 위험: 신호가 너무 자주 발생하면 과도한 거래가 발생할 수 있다. 제안된 해결책: 하루 최대 거래 횟수 제한을 합리적으로 설정하십시오.
전략 최적화 방향
- 동적 매개 변수 최적화: 시장의 변동에 따라 동적 하락값과 EMA 주기를 자동으로 조정할 수 있다.
- 다중 시간 주기의 분석: 여러 시간 주기의 추세를 확인하여 신호 신뢰도를 높인다.
- 시장 환경 인식: 변동률 분석 모듈을 추가하여 다른 시장 환경에서 다른 파라미터 설정을 사용합니다.
- 신호 강도 등급: 돌파 신호에 강도 등급을 적용하고, 신호 강도에 따라 포지션 규모를 조정한다.
요약하다
이것은 동력 돌파와 EMA 트렌드를 결합하는 방식으로 시장 기회를 포착하기 위해 잘 설계된 트렌드 추적 전략입니다. 전략의 위험 관리 시스템은 완전하고, 통계 분석 기능은 강력하며, 실용성과 확장성이 좋습니다. 지속적인 최적화 및 개선으로 전략은 다양한 시장 환경에서 안정적인 성능을 유지할 수 있습니다.
전략 소스 코드
/*backtest
start: 2019-12-23 08:00:00
end: 2024-12-09 08:00:00
period: 2d
basePeriod: 2d
exchanges: [{"eid":"Futures_Binance","currency":"BTC_USDT"}]
*/

//@version=6
strategy("[Mustang Algo] EMA Momentum Strategy",
         shorttitle="[Mustang Algo] Mom Strategy",
         overlay=true,
         initial_capital=10000,
         default_qty_type=strategy.fixed,
         default_qty_value=1,
         pyramiding=0,
         calc_on_every_tick=false,
         max_bars_back=5000)

// Momentum Parameters
len = input.int(10, minval=1, title="Length")
src = input(close, title="Source")
momTimeframe = input.timeframe("", title="Momentum Timeframe")
timeframe_gaps = input.bool(true, title="Autoriser les gaps de timeframe")
momFilterLong = input.float(5, title="Filtre Momentum Long", minval=0)
momFilterShort = input.float(-5, title="Filtre Momentum Short", maxval=0)

// EMA Filter
useEmaFilter = input.bool(true, title="Utiliser Filtre EMA")
emaLength = input.int(200, title="EMA Length", minval=1)

// Position Size
contractSize = input.float(1.0, title="Taille de position", minval=0.01, step=0.01)

// Time filter settings
use_time_filter = input.bool(false, title="Utiliser le Filtre de Temps")
start_hour = input.int(9, title="Heure de Début", minval=0, maxval=23)
start_minute = input.int(30, title="Minute de Début", minval=0, maxval=59)
end_hour = input.int(16, title="Heure de Fin", minval=0, maxval=23)
end_minute = input.int(30, title="Minute de Fin", minval=0, maxval=59)
gmt_offset = input.int(0, title="Décalage GMT", minval=-12, maxval=14)

// Risk Management
useAtrSl = input.bool(false, title="Utiliser ATR pour SL/TP")
atrPeriod = input.int(14, title="Période ATR", minval=1)
atrMultiplier = input.float(1.5, title="Multiplicateur ATR pour SL", minval=0.1, step=0.1)
stopLossPerc = input.float(1.0, title="Stop Loss (%)", minval=0.01, step=0.01)
tpRatio = input.float(2.0, title="Take Profit Ratio", minval=0.1, step=0.1)

// Daily trade limit
maxDailyTrades = input.int(2, title="Limite de trades par jour", minval=1)

// Variables for tracking daily trades
var int dailyTradeCount = 0

// Reset daily trade count
if dayofweek != dayofweek[1]
    dailyTradeCount := 0

// Time filter function
is_within_session() =>
    current_time = time(timeframe.period, "0000-0000:1234567", gmt_offset)
    start_time = timestamp(year, month, dayofmonth, start_hour, start_minute, 0)
    end_time = timestamp(year, month, dayofmonth, end_hour, end_minute, 0)
    in_session = current_time >= start_time and current_time <= end_time
    not use_time_filter or in_session

// EMA Calculation
ema200 = ta.ema(close, emaLength)

// Momentum Calculation
gapFillMode = timeframe_gaps ? barmerge.gaps_on : barmerge.gaps_off
mom = request.security(syminfo.tickerid, momTimeframe, src - src[len], gapFillMode)

// ATR Calculation
atr = ta.atr(atrPeriod)

// Signal Detection with Filters
crossoverUp = ta.crossover(mom, momFilterLong)
crossoverDown = ta.crossunder(mom, momFilterShort)

emaUpTrend = close > ema200
emaDownTrend = close < ema200

// Trading Conditions
longCondition = crossoverUp and (not useEmaFilter or emaUpTrend) and is_within_session() and dailyTradeCount < maxDailyTrades and barstate.isconfirmed
shortCondition = crossoverDown and (not useEmaFilter or emaDownTrend) and is_within_session() and dailyTradeCount < maxDailyTrades and barstate.isconfirmed

// Calcul des niveaux de Stop Loss et Take Profit
float stopLoss = useAtrSl ? (atr * atrMultiplier) : (close * stopLossPerc / 100)
float takeProfit = stopLoss * tpRatio

// Modification des variables pour éviter les erreurs de repainting
var float entryPrice = na
var float currentStopLoss = na
var float currentTakeProfit = na

// Exécution des ordres avec gestion des positions
if strategy.position_size == 0
    if longCondition
        entryPrice := close
        currentStopLoss := entryPrice - stopLoss
        currentTakeProfit := entryPrice + takeProfit
        strategy.entry("Long", strategy.long, qty=contractSize)
        strategy.exit("Exit Long", "Long", stop=currentStopLoss, limit=currentTakeProfit)
        dailyTradeCount += 1

    if shortCondition
        entryPrice := close
        currentStopLoss := entryPrice + stopLoss
        currentTakeProfit := entryPrice - takeProfit
        strategy.entry("Short", strategy.short, qty=contractSize)
        strategy.exit("Exit Short", "Short", stop=currentStopLoss, limit=currentTakeProfit)
        dailyTradeCount += 1

// Plot EMA
plot(ema200, color=color.yellow, linewidth=2, title="EMA 200")

// Plot Signals
plotshape(longCondition, title="Long Signal", location=location.belowbar, color=color.green, style=shape.triangleup, size=size.small)
plotshape(shortCondition, title="Short Signal", location=location.abovebar, color=color.red, style=shape.triangledown, size=size.small)

// // Performance Statistics
// var int longWins = 0
// var int longLosses = 0
// var int shortWins = 0
// var int shortLosses = 0

// if strategy.closedtrades > 0
//     trade = strategy.closedtrades - 1
//     isLong = strategy.closedtrades.entry_price(trade) < strategy.closedtrades.exit_price(trade)
//     isWin = strategy.closedtrades.profit(trade) > 0

//     if isLong and isWin
//         longWins += 1
//     else if isLong and not isWin
//         longLosses += 1
//     else if not isLong and isWin
//         shortWins += 1
//     else if not isLong and not isWin
//         shortLosses += 1

// longTrades = longWins + longLosses
// shortTrades = shortWins + shortLosses

// longWinRate = longTrades > 0 ? (longWins / longTrades) * 100 : 0
// shortWinRate = shortTrades > 0 ? (shortWins / shortTrades) * 100 : 0
// overallWinRate = strategy.closedtrades > 0 ? (strategy.wintrades / strategy.closedtrades) * 100 : 0

// avgRR = strategy.grossloss != 0 ? math.abs(strategy.grossprofit / strategy.grossloss) : 0

// // Display Statistics
// var table statsTable = table.new(position.top_right, 4, 7, border_width=1)
// if barstate.islastconfirmedhistory
//     table.cell(statsTable, 0, 0, "Type", bgcolor=color.new(color.blue, 90))
//     table.cell(statsTable, 1, 0, "Win", bgcolor=color.new(color.blue, 90))
//     table.cell(statsTable, 2, 0, "Lose", bgcolor=color.new(color.blue, 90))
//     table.cell(statsTable, 3, 0, "Daily Trades", bgcolor=color.new(color.blue, 90))
//     table.cell(statsTable, 0, 1, "Long", bgcolor=color.new(color.blue, 90))
//     table.cell(statsTable, 1, 1, str.tostring(longWins), bgcolor=color.new(color.blue, 90))
//     table.cell(statsTable, 2, 1, str.tostring(longLosses), bgcolor=color.new(color.blue, 90))
//     table.cell(statsTable, 3, 1, str.tostring(dailyTradeCount) + "/" + str.tostring(maxDailyTrades), bgcolor=color.new(color.blue, 90))
//     table.cell(statsTable, 0, 2, "Short", bgcolor=color.new(color.blue, 90))
//     table.cell(statsTable, 1, 2, str.tostring(shortWins), bgcolor=color.new(color.blue, 90))
//     table.cell(statsTable, 2, 2, str.tostring(shortLosses), bgcolor=color.new(color.blue, 90))
//     table.cell(statsTable, 0, 3, "Win Rate", bgcolor=color.new(color.blue, 90))
//     table.cell(statsTable, 1, 3, "Long: " + str.tostring(longWinRate, "#.##") + "%", bgcolor=color.new(color.blue, 90))
//     table.cell(statsTable, 2, 3, "Short: " + str.tostring(shortWinRate, "#.##") + "%", bgcolor=color.new(color.blue, 90))
//     table.cell(statsTable, 0, 4, "Overall", bgcolor=color.new(color.blue, 90))
//     table.cell(statsTable, 1, 4, "Win Rate: " + str.tostring(overallWinRate, "#.##") + "%", bgcolor=color.new(color.blue, 90))
//     table.cell(statsTable, 2, 4, "Total: " + str.tostring(strategy.closedtrades) + " | RR: " + str.tostring(avgRR, "#.##"), bgcolor=color.new(color.blue, 90))
//     table.cell(statsTable, 0, 5, "Trading Hours", bgcolor=color.new(color.blue, 90))
//     table.cell(statsTable, 1, 5, "Start: " + str.format("{0,time,HH:mm}", start_hour * 60 * 60 * 1000 + start_minute * 60 * 1000), bgcolor=color.new(color.blue, 90))
//     table.cell(statsTable, 2, 5, "End: " + str.format("{0,time,HH:mm}", end_hour * 60 * 60 * 1000 + end_minute * 60 * 1000), bgcolor=color.new(color.blue, 90))
//     table.cell(statsTable, 3, 5, "GMT: " + (gmt_offset >= 0 ? "+" : "") + str.tostring(gmt_offset), bgcolor=color.new(color.blue, 90))
//     table.cell(statsTable, 0, 6, "SL/TP Method", bgcolor=color.new(color.blue, 90))
//     table.cell(statsTable, 1, 6, useAtrSl ? "ATR-based" : "Percentage-based", bgcolor=color.new(color.blue, 90))
//     table.cell(statsTable, 2, 6, useAtrSl ? "ATR: " + str.tostring(atrPeriod) : "SL%: " + str.tostring(stopLossPerc), bgcolor=color.new(color.blue, 90))
//     table.cell(statsTable, 3, 6, "TP Ratio: " + str.tostring(tpRatio), bgcolor=color.new(color.blue, 90))