
1
Follow
1780
Followers
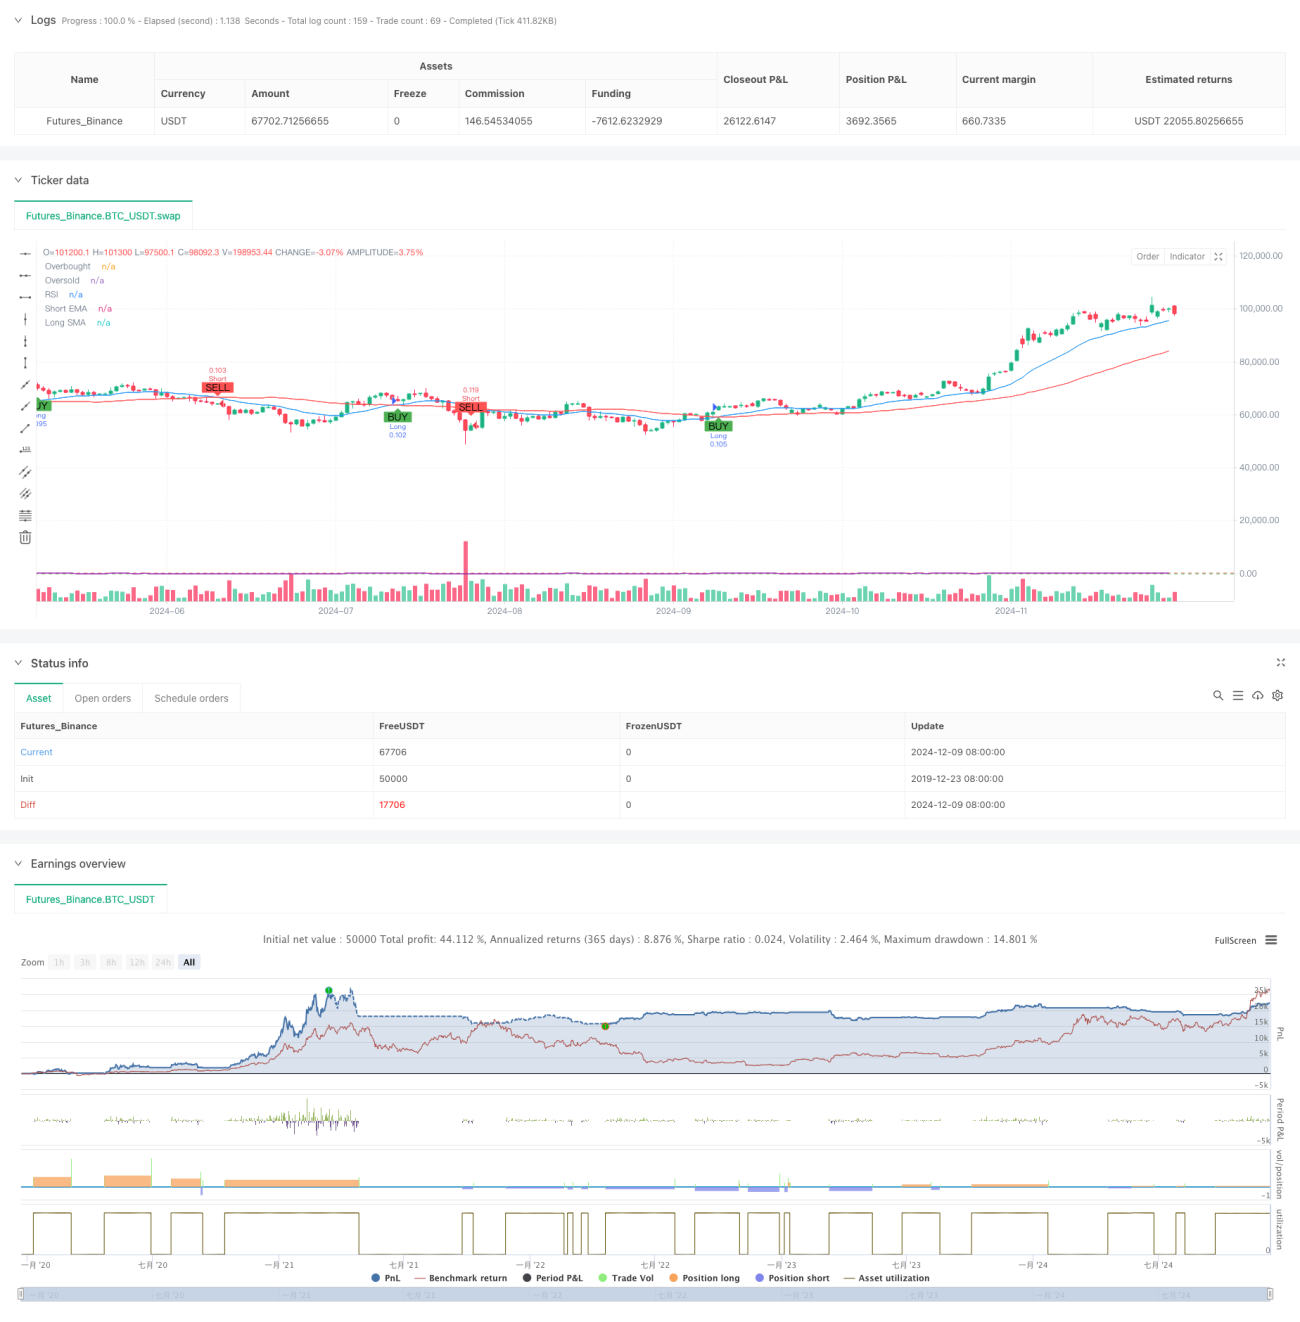
개요
이 전략은 기술 지표에 기반한 변동 거래 전략으로, 평행선 교차, RSI 오버 바이 오버 셀, ATR 스톱 스톱 등과 같은 여러 신호를 결합한다. 이 전략의 핵심은 단기 EMA와 장기 SMA의 교차를 통해 시장 추세를 포착하는 것이며, RSI 지표를 사용하여 신호 확인을 하고, ATR을 통해 스톱 스톱 스톱 위치를 설정한다. 이 전략은 다공간 양방향 거래를 지원하며, 사용자의 선호에 따라 한 방향으로 유연하게 켜거나 닫을 수 있다.
전략 원칙
전략은 다층적인 기술 지표 조합을 사용하여 거래 시스템을 구성합니다.
- 트렌드 판단 계층: 20주기 EMA와 50주기 SMA의 교차를 사용하여 트렌드 방향을 판단합니다. EMA 상단 SMA는 다중 신호로 간주되며, 하단 SMA는 공백 신호로 간주됩니다.
- 동력 확인 계층: RSI 지표를 사용하여 과매매 판단을 합니다. RSI가 70보다 낮으면 과매매가 허용되며, 30보다 높으면 공백이 허용됩니다.
- 변동성 계산 계층: 14주기 ATR을 사용하여 스톱 스톱 위치를 계산하고, 스톱 스톱은 1.5배 ATR, 스톱 스톱은 3배 ATR로 설정한다.
- 포지션 관리: 초기 자본과 거래 당 위험 비율 (기본 1%) 을 기반으로 포지션 개시 수를 동적으로 계산한다.
전략적 이점
- 다중 신호 확인: 평평선 교차, RSI 및 ATR 삼중 지표의 조합을 통해 가짜 신호 간섭을 효과적으로 줄인다.
- 다이내믹 스톱 스톱: ATR에 기반한 다이내믹 스톱 스톱 위치를 조정하여 시장의 변동성에 더 잘 적응할 수 있다.
- 유연한 거래 방향: 시장 환경에 따라 개별적으로 멀티 헤드 또는 홀 헤드 거래를 활성화 할 수 있습니다.
- 엄격한 리스크 제어: 비율 리스크 제어 및 동적 포지션 관리를 통해 거래 당 리스크 <unk>을 효과적으로 제어한다.
- 시각화 지원: 전략은 신호 표기 및 지표 표시를 포함한 완전한 차트 시각화 지원을 제공합니다.
전략적 위험
- 흔들림 시장의 위험: 수평판 흔들림 시장에서, 평평선 교차는 과도한 가짜 신호를 생성할 수 있다.
- 슬라이드 포인트 위험: 급격한 변동 기간 동안 실제 거래 가격은 신호 가격과 큰 편차가 있을 수 있다.
- 자금 관리 위험: 너무 높은 위험 비율을 설정하면 단일 손실이 너무 커질 수 있습니다.
- 매개 변수 민감성: 정책 효과는 매개 변수 설정에 민감하며, Careful 조정이 필요합니다.
전략 최적화 방향
- 트렌드 강도 필터를 추가: 트렌드 강도가 약한 상황에서 거래 신호를 필터링하기 위해 ADX 지표를 추가할 수 있습니다.
- 최적화 평균선 주기: 다양한 시장 주기 특성에 따라 평균선 파라미터를 동적으로 조정할 수 있다.
- 손해 차단 기능: 손해 차단 기능을 추가하여 수익을 더 잘 보호할 수 있습니다.
- 거래량 확인이 증가: 거래량 지표를 추가하여 신호 신뢰성을 향상시킵니다.
- 시장 환경 분류: 시장 환경 식별 모듈을 추가하여 다른 시장 환경에서 다른 파라미터 조합을 사용합니다.
요약하다
이 전략은 여러 기술적 지표의 조합을 사용하여 비교적 완전한 거래 시스템을 구축한다. 전략의 장점은 신호 확인의 신뢰성과 위험 관리의 완전성에 있다. 그러나 또한 시장 환경이 전략의 성능에 미치는 영향을 주의해야 한다. 제안된 최적화 방향을 통해 전략에는 큰 개선 공간이 있다. 실내 적용 시에는 충분한 매개 변수 테스트와 재검증이 권장된다.
Source
Pine
/*backtest
start: 2019-12-23 08:00:00
end: 2024-12-10 08:00:00
period: 1d
basePeriod: 1d
exchanges: [{"eid":"Futures_Binance","currency":"BTC_USDT"}]
*/

// This Pine Script™ code is subject to the terms of the Mozilla Public License 2.0 at https://mozilla.org/MPL/2.0/
// © CryptoRonin84

//@version=5Strategy parameters
Related strategies
Comment
All comments (0)
No data
- 1