
1
Follow
1802
Followers
개요
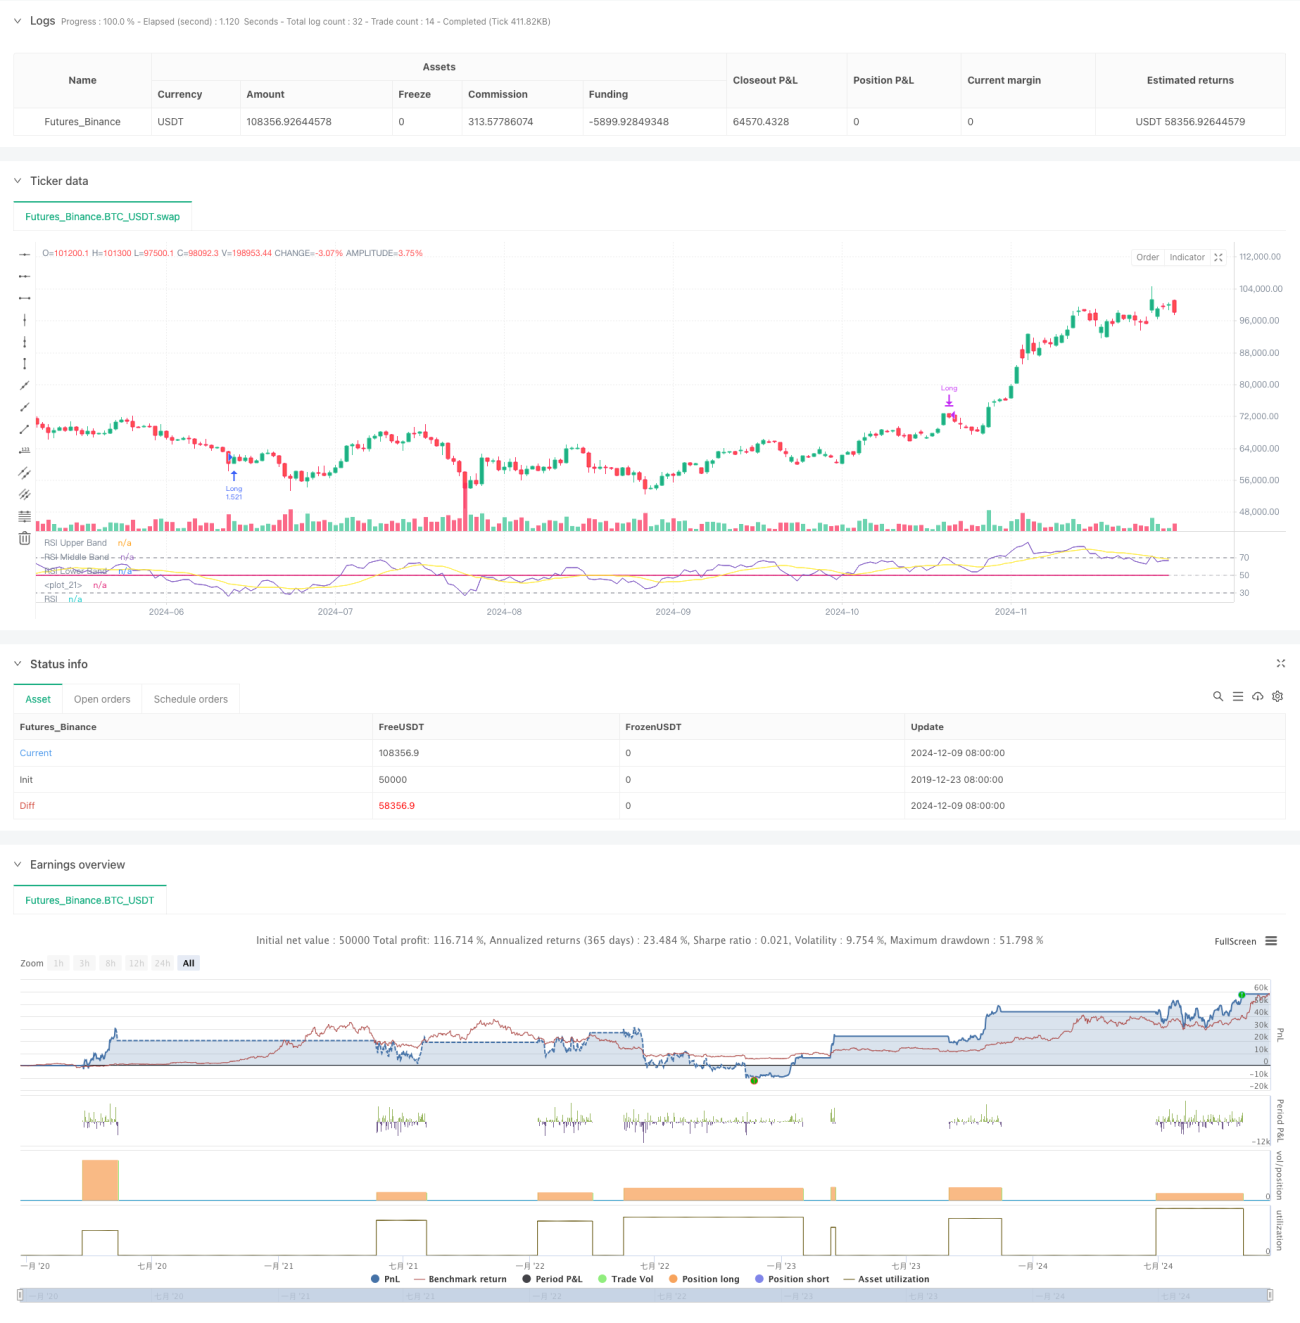
본 전략은 상대강도지수(RSI)를 기반으로 한 스마트 트레이딩 시스템으로, 다양한 이동평균선과 볼린저 밴드 지표를 결합하여 시장의 과매수/과매도 영역을 식별하고 타이밍 거래를 수행합니다. 전략의 핵심은 RSI의 돌파 및 하락 신호를 활용하고, 다양한 유형의 이동평균선을 통해 추세를 확인하여 효율적인 스윙 트레이딩을 구현하는 데 있습니다. 이 전략은 적응성이 높아 다양한 시장 환경에 맞춰 매개변수를 조정할 수 있습니다.
전략 원리
이 전략은 14주기 RSI를 핵심 지표로 사용하며, RSI가 30/70이라는 두 가지 주요 수준을 교차하는 상황을 모니터링하여 거래 신호를 생성합니다. RSI가 30을 상향 돌파하면 시장이 과매도에서 강세로 전환되었다고 판단하여 매수 신호를 발생시킵니다. RSI가 70을 하향 돌파하면 시장이 과매수에서 약세로 전환되었다고 판단하여 청산 신호를 발생시킵니다. 동시에 전략은 여러 이동평균선(SMA, EMA, SMMA, WMA, VWMA)과 볼린저 밴드를 보조 지표로 도입하여 추세 방향과 시장 변동성을 확인하는 데 사용합니다.
전략 장점
- 명확한 신호: RSI 지표의 과매수/과매도 신호가 명확하여 이해하고 실행하기 쉽습니다.
- 위험 통제 가능: 명확한 진입 및 청산 조건을 설정하여 위험을 효과적으로 통제합니다.
- 유연성 높음: 다양한 이동평균선 유형을 지원하며 시장 상황에 따라 유연하게 전환할 수 있습니다.
- 적응성: 볼린저 밴드가 시장 변동성에 따라 자동으로 거래 구간을 조정합니다.
- 최적화 용이성: 매개변수 조정이 용이하여 다양한 시장 상황에 맞춰 최적화하기 쉽습니다.
전략 리스크
- 횡보장 리스크: 횡보하는 시장에서 잦은 가짜 돌파 신호가 발생할 수 있습니다.
- 추세 지속 리스크: 너무 빠른 청산으로 큰 추세장에서 수익을 놓칠 수 있습니다.
- 매개변수 민감성: 서로 다른 매개변수 설정에 따라 전략 성과의 차이가 클 수 있습니다.
- 슬리피지 영향: 유동성이 낮은 시장에서는 큰 슬리피지가 발생할 수 있습니다.
- 시스템 리스크: 극단적인 시장 환경에서는 연속적인 손절매가 발생할 수 있습니다.
전략 최적화 방향
- 거래량 지표 도입: 거래량을 통해 신호 유효성을 확인합니다.
- 추세 필터 추가: 더 긴 주기의 추세 판단을 결합하여 역추세 거래를 피합니다.
- 손절매 메커니즘 최적화: 동적 손절매 도입으로 자금 활용 효율성을 높입니다.
- 포지션 관리 개선: 시장 변동성에 따라 포지션 크기를 동적으로 조정합니다.
- 시장 심리 지표 추가: 다른 기술 지표와 결합하여 신호 정확도를 높입니다.
결론
이 전략은 RSI 지표를 통해 시장의 과매수/과매도 기회를 포착하고 다양한 기술 지표를 결합하여 신호를 확인함으로써 실용성과 신뢰성이 높습니다. 전략 설계는 위험 통제를 충분히 고려했으며, 매개변수 최적화와 지표 조합을 통해 다양한 시장 환경에 적응할 수 있습니다. 트레이더는 실전 운용 전에 충분한 백테스트 검증을 수행하고, 특정 시장 특성에 맞춰 매개변수 설정을 조정할 것을 권장합니다.
Source
Pine
/*backtest
start: 2019-12-23 08:00:00
end: 2024-12-10 08:00:00
period: 1d
basePeriod: 1d
exchanges: [{"eid":"Futures_Binance","currency":"BTC_USDT"}]
*/

//@version=5
strategy(title="Demo GPT - Relative Strength Index", shorttitle="RSI Strategy", overlay=false, default_qty_type=strategy.percent_of_equity, default_qty_value=100, commission_value=0.1, slippage=3)

// InputsStrategy parameters
Related strategies
Comment
All comments (0)
No data
- 1