
1
Follow
1781
Followers
개요
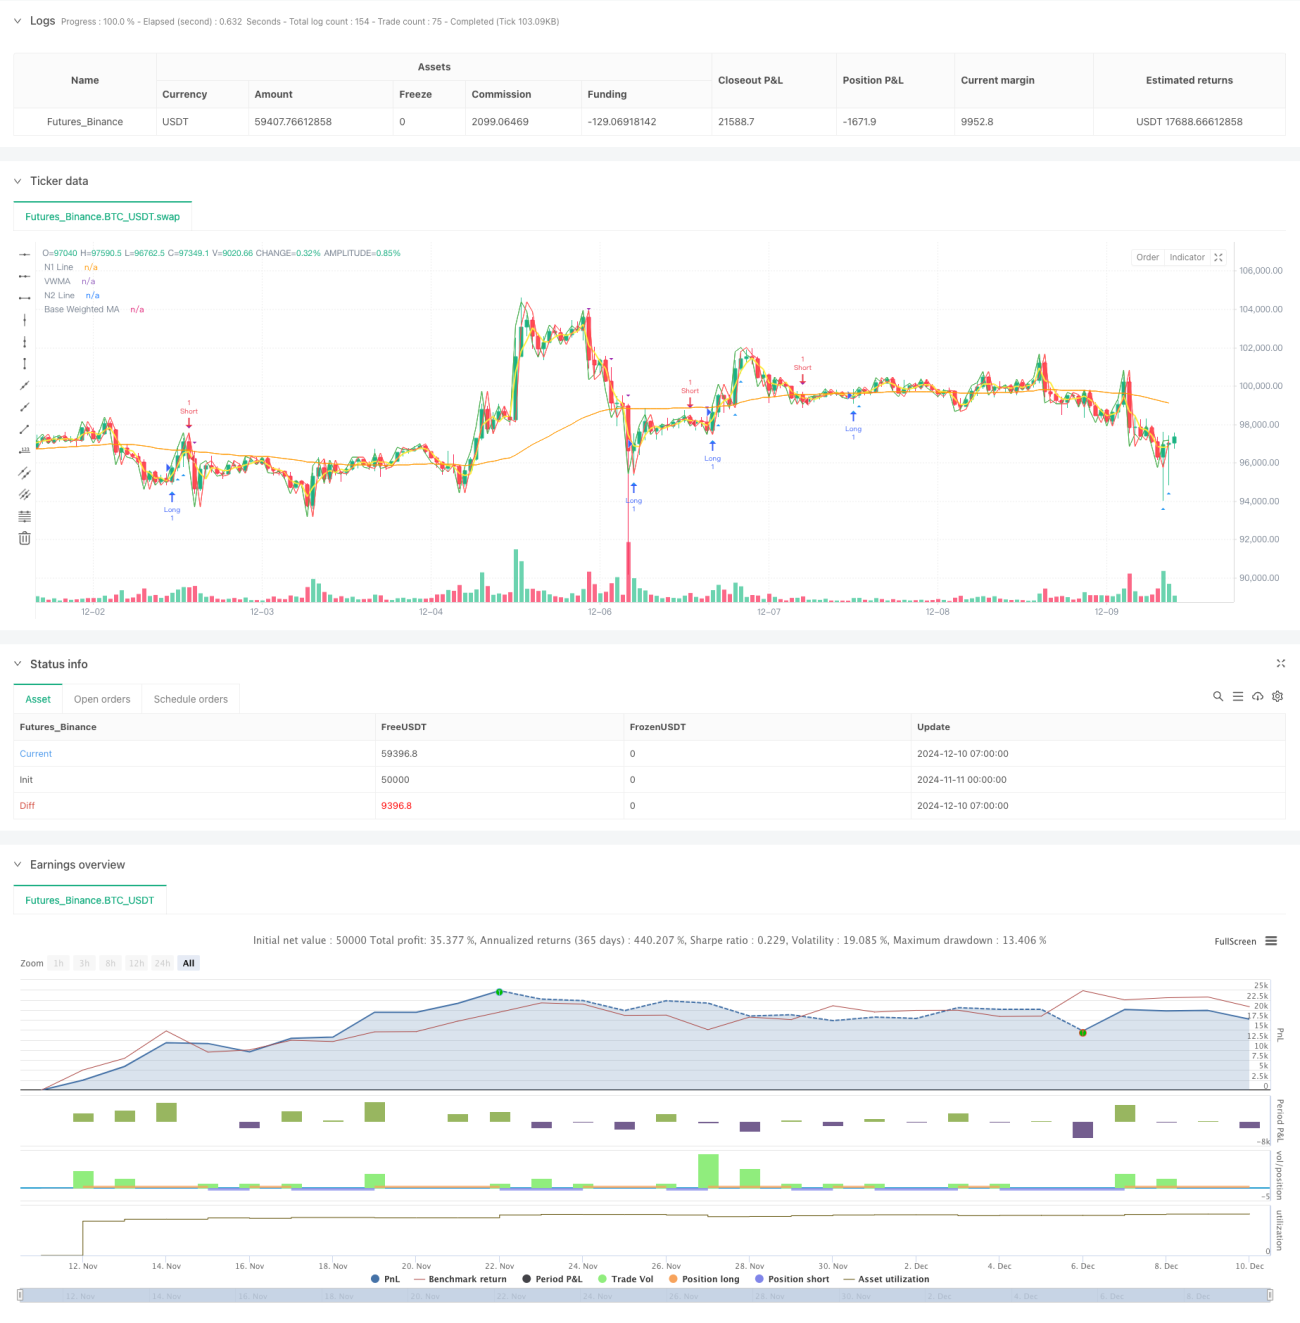
이 전략은 여러 평균선, 상대적으로 약한 지표 ((RSI), 평균 트렌드 지표 ((ADX) 와 거래량 분석을 결합한 통합적인 양적 거래 시스템이다. 이 전략은 여러 기술 지표의 협동적인 협조를 통해 트렌드 확인에 기초하여 거래를 수행하고 거래량과 동력 지표의 필터링을 통해 거래 신뢰성을 향상시킵니다.
전략 원칙
전략의 핵심 논리는 다음과 같은 핵심 구성 요소를 기반으로 합니다.
- 이중 헐 평균선 ((Double Hull MA) 과 교차량 가중 이동 평균선 ((VWMA) 과 기본 가중 이동 평균선 ((WMA) 을 사용하여 다중 평균선 시스템을 구축
- ADX 지표로 트렌드 강도를 판단하고 트렌드가 뚜렷한 경우에만 거래합니다.
- RSI 지표를 사용하여 극한 시장 상태를 필터링하여 지역 거래를 과도하게 구매하거나 판매하는 것을 피하십시오.
- 합성 거래량 분석으로 거래 신호가 발생했을 때 거래량이 특정 임계치를 초과하도록 요구
- n1 및 n2 선의 교차로 특정 거래 방향을 결정합니다.
다중평균선 시스템은 가격 추세에 대한 기준 판단을 제공하며, ADX는 추세가 충분히 강할 때만 거래하는 것을 보장하며, RSI는 추락을 추적하는 것을 피하고, 거래량 분석은 거래가 시장의 활동성이 높은 시기에 이루어지는 것을 보장합니다.
전략적 이점
- 복수 인증 메커니즘은 가짜 침입의 위험을 낮춰줍니다.
- 기술 지표와 거래량 분석을 결합하여 거래의 신뢰성을 향상시킵니다.
- RSI 필터링으로 극한시장 상황을 피하고 불리한 시점에 진입합니다.
- ADX의 사용은 트렌드가 분명할 때만 거래하는 것을 보장하고 승률을 높여줍니다.
- 거래량 요청은 시장의 합의를 확인하는 데 도움이 됩니다.
- 전략 논리는 명확하고 매개변수는 매우 조정 가능합니다.
전략적 위험
- 다중 필터링 조건으로 인해 일부 거래 기회를 놓칠 수 있습니다.
- 시장의 흔들림 속에서 부진할 수도 있다.
- 매개변수 최적화로 인해 과적합이 발생할 수 있습니다.
- 평균선 시스템은 빠른 역행 시 반응이 지연될 수 있다
- 거래량 필터링은 유동성이 낮은 시장에서 거래 기회를 제한할 수 있습니다.
다음의 방법으로 위험을 관리하는 것이 좋습니다.
- 다른 시장 특성에 따라 변수를 조정
- 적당한 스톱을 설정하세요.
- 각 거래에 대한 자본 비율을 제어합니다.
- 전략의 유효성을 주기적으로 재검토합니다.
전략 최적화 방향
- 시장 상황에 따라 동적으로 조정하기 위한 적응형 매개변수 메커니즘 도입
- 시장 변동율 필터를 추가하여 높은 변동성 기간 동안 포지션을 조정합니다.
- 출전 메커니즘을 개선하고, 손실 추적을 추가하는 것을 고려할 수 있다.
- 절대값이 아닌 상대적인 거래량을 고려하여 거래량 필터를 최적화하십시오.
- 중요한 소식이 나오지 않도록 시간 필터를 추가하세요.
- 가격 변동성 지표를 추가하여 시장 위험을 인식하는 것을 고려하십시오.
요약하다
이 전략은 여러 기술 지표의 협동적 협동으로 비교적 완벽한 트렌드 추적 시스템을 구축한다. 전략의 주요 특징은 여러 가지 확인을 통해 거래의 신뢰성을 높이고, 다양한 필터를 통해 위험을 제어하는 것이다. 일부 거래 기회를 놓칠 수 있지만, 전체적으로 거래의 안정성을 높이는 데 도움이 된다.
Source
Pine
Strategy parameters
Related strategies
Comment
All comments (0)
No data
- 1