
1
Follow
1781
Followers
개요
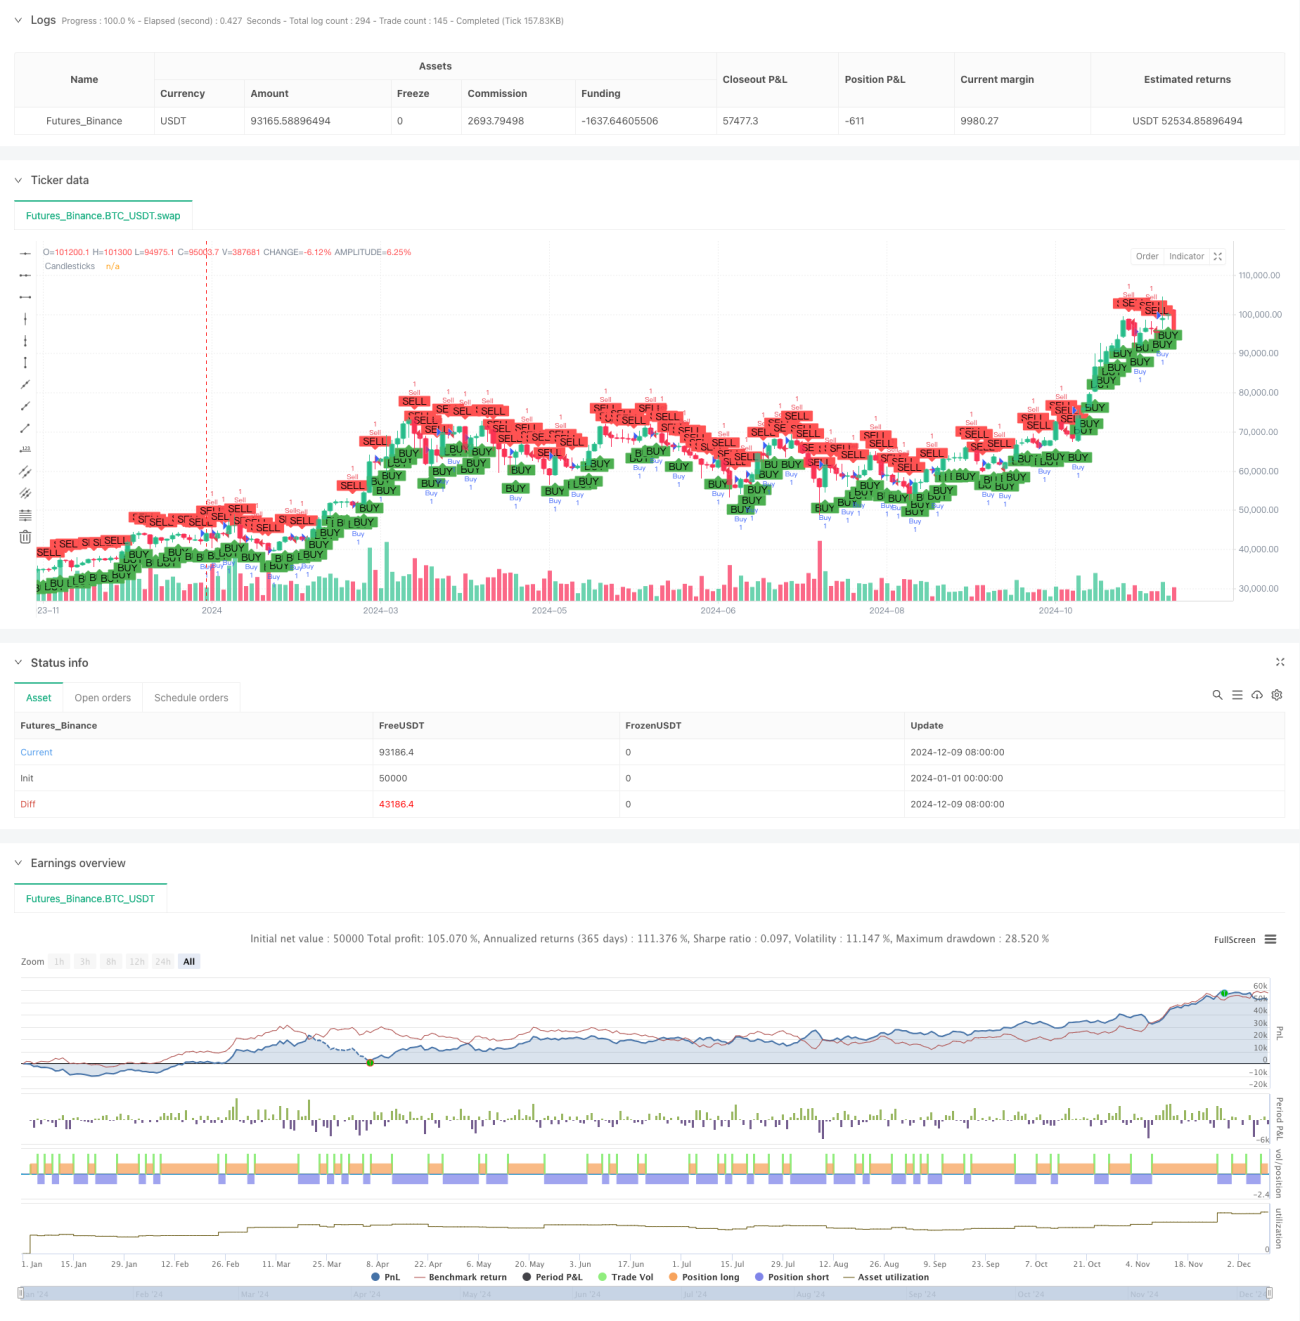
이것은 1분 K 선의 종결 방향에 기초한 고주파 거래의 전략이다. 전략은 K 선의 종결 가격과 개시 가격의 관계를 판단하여 시장의 움직임을 결정하고, 보잉 K 선이 형성된 후에 더하고, 하향 K 선이 형성된 후에 공백한다. 전략은 고정된 포지션 시간을 채택하고, 다음 K 선의 종결시 포지션을 평정하고, 하루 최대 거래 수에 제한을 두고, 위험을 제어한다.
전략 원칙
전략의 핵심 논리는 K선으로 종결 방향을 판단하는 것입니다.
- 상장 가격이 상장 가격보다 높을 때, 양선이 형성되며, 이는 현재 주기의 구매자 세력이 우위를 점하고, 전략 선택이 더 많은 것을 나타냅니다.
- 상장 가격이 상장 가격보다 낮을 때, 음선이 형성되며, 이는 현재 주기에 대한 판매자의 힘이 우위를 점하고, 전략이 공백을 선택한다는 것을 나타냅니다.
- 이 전략은 K 라인이 문을 닫을 때 문을 닫습니다. 빠른 수익 또는 손실을 달성합니다.
- 매일 200건의 거래가 제한되어 과도한 거래가 발생하지 않도록 합니다.
- 매 거래마다 계좌의 1%의 자금을 사용해서 위험을 통제한다.
전략적 이점
- 거래 논리는 간단하고 명확하며 이해하기 쉽고 실행이 가능합니다.
- 시장 변동에 대한 위험을 줄이는 짧은 포지션
- 주관적 판단의 편차를 피하기 위해 고정된 지분 기간을 사용합니다.
- 매일 최대 거래 수 제한을 설정하여 위험을 효과적으로 제어합니다.
- 백분율 리스크 관리를 사용하여 계좌 자금을 안전하게 보호하십시오.
- 거래 신호를 시각적으로 표시하여 전략 모니터링 및 최적화를 지원합니다.
전략적 위험
- 높은 주파수 거래는 높은 거래 비용을 초래할 수 있습니다.
해결책: 더 작은 차이는 거래 유형을 선택하고 거래 기간을 최적화하십시오. - 급격하게 변동하는 시장에서 연속적인 손실이 발생할 수 있습니다.
해결책: 시장의 변동성을 필터링하는 조건을 늘려라 - 전략은 가짜 돌파구에 의해 영향을 받을 수 있습니다.
해결책: 교류량 증가와 같은 보조적인 지표를 확인 - 고정 지분 기간은 더 큰 수익 기회를 놓칠 수 있습니다.
해결책: 시장 상황에 따라 지분 시간을 동적으로 조정합니다. - 더 많은 시장 정보와 기술 지표가 고려되지 않았습니다.
솔루션: 다른 기술 지표와 결합하여 입학 조건을 최적화
전략 최적화 방향
- 거래량 지표 도입: 거래량을 통해 K 라인의 유효성을 확인하고 거래 신호의 신뢰성을 향상시킵니다.
- 트렌드 필터를 추가: 평균선과 같은 트렌드 지표와 결합하여 주 트렌드 방향으로 거래
- 역동적인 포지션 보유 시간: 시장의 변동에 따라 포지션 보유 시간을 역동적으로 조정하여 전략의 적응성을 향상시킵니다.
- 자본 관리를 최적화: 역대 이익과 손실에 따라 역동적으로 위치 크기를 조정
- 시장 변동성 필터를 추가합니다: 과도한 변동성 또는 과도한 변동성 시장 환경에서 거래를 중지합니다.
- 시간 필터를 추가하여, 시장의 높은 변동성을 피하십시오.
요약하다
이 전략은 간단한 가격 행동 분석을 통해 단기 시장 기회를 잡기 위해 K선 종결 방향에 기반한 고주파 거래 시스템입니다. 전략의 장점은 논리적으로 간단하고, 지주 기간이 짧고, 위험이 통제 가능하지만, 동시에 거래 비용과 가짜 돌파구와 같은 과제에 직면합니다. 전략의 안정성과 수익성은 더 많은 기술적 지표와 최적화 프로그램을 도입함으로써 더욱 향상 될 것으로 예상됩니다.
Source
Pine
Comment
All comments (0)
No data
- 1