다중 기간 볼린저 밴드는 추세 반전 양적 거래 전략을 터치합니다.

1
Follow
1781
Followers
개요
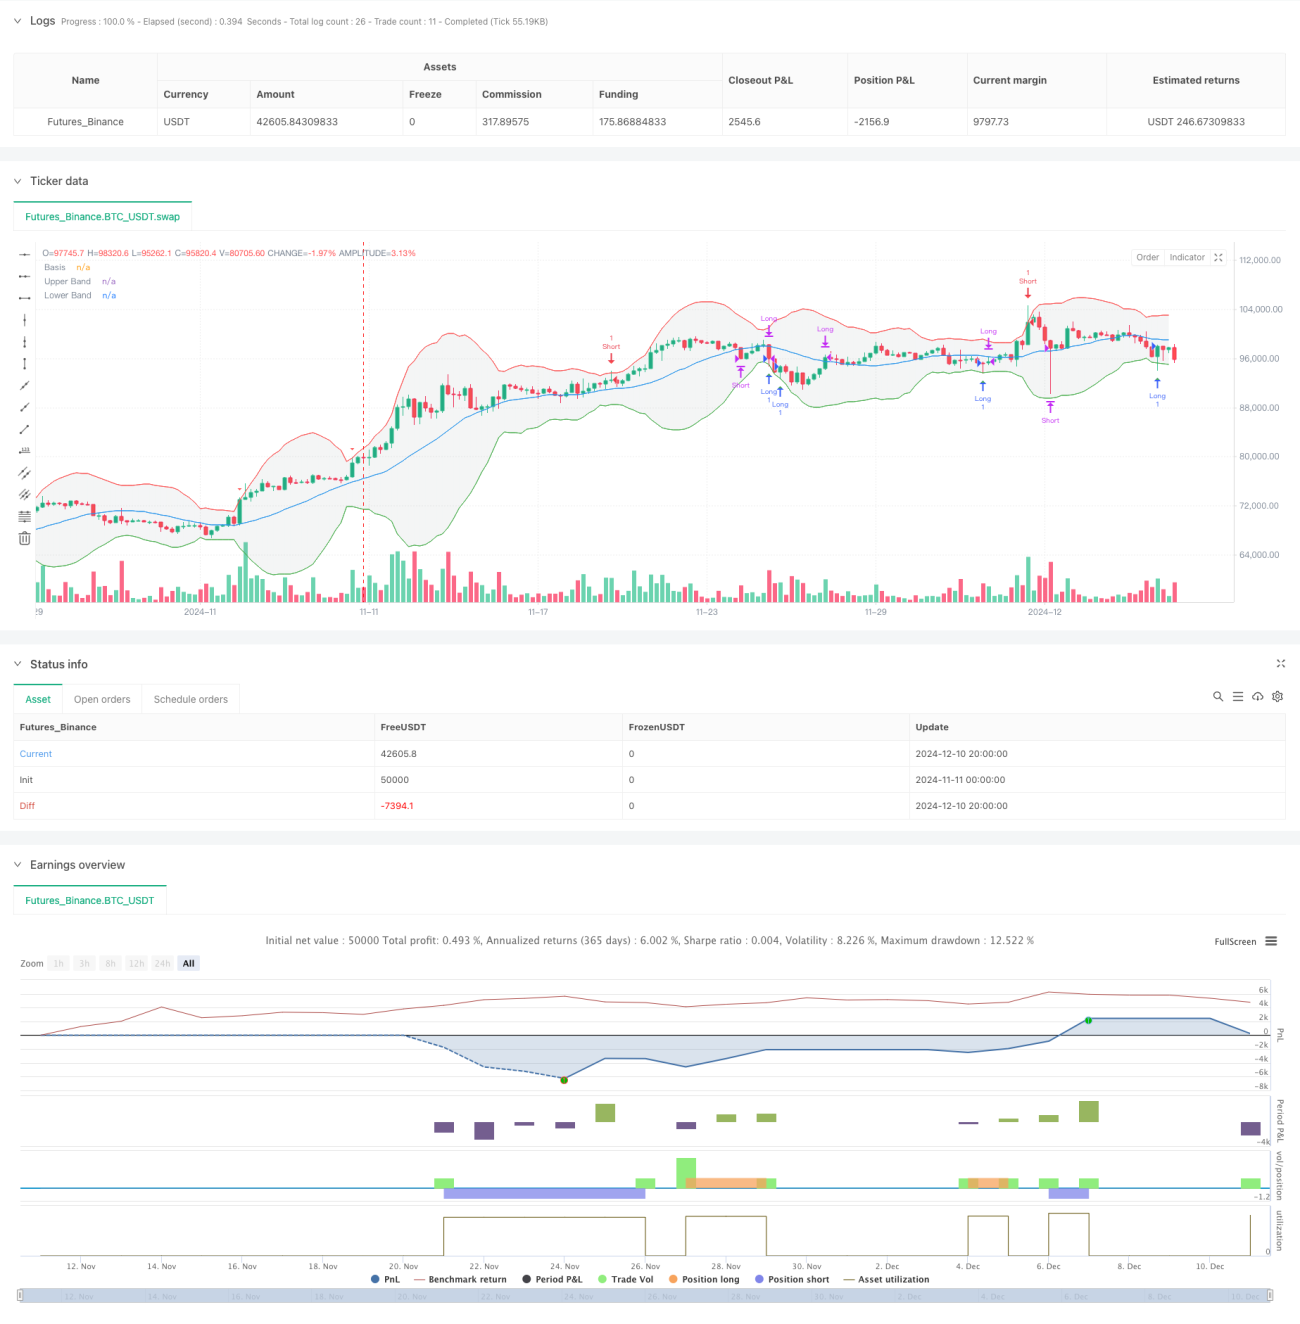
이 전략은 부린 띠 지표에 기반한 트렌드 반전 거래 시스템으로, 가격과 부린 띠의 접촉 관계를 모니터링하여 시장 반전 기회를 포착합니다. 전략은 5 분 시간 주기에서 작동하며, 20 주기의 이동 평균을 부린 띠의 중간 경로로 사용하고, 3.4 배의 표준 차이를 부린 띠의 경로로 설정합니다. 가격이 부린 띠의 경로로 연결되면, 시스템은 그에 따른 거래 신호를 냅니다.
전략 원칙
전략의 핵심 논리는 가격 회귀 이론에 기초한다. 가격이 부린을 타면 시장이 과매매되었다고 생각하여 과다 거래하는 경향이 있다. 가격이 부린을 타면 시장이 과매매되었다고 생각하여 과매매하는 경향이 있다. 구체적으로:
- 다중 조건: 5분 K 선의 최저가격이 처음 부린带下轨에 닿거나 돌파했을 때 ((현 K 선 최저가격 <=下轨, 전 K 선 최저가격>下轨)
- 공백 조건: 5분 K 선의 최고가격이 처음 부린 벨트를 터치하거나 돌파했을 때 (현재의 K 선 최고가격>= 상행, 전의 K 선 최고가격<상행)
- 출구 조건: 가격이 부린 반도 중궤도 평행점으로 돌아간다.
전략적 이점
- 지표 선택의 합리성: 브린 띠는 트렌드 및 변동률 정보를 통합하여 시장 상태를 효과적으로 식별합니다.
- 진입 시점 정확도: 브린의 첫 번째 접촉을 통해 반전 신호를 포착하여 추격 추락을 피할 수 있습니다.
- 풍력 제어 논리 개선: 이동 평균을 기준으로 삼아 수익을 보호하고 조기 퇴장하지 않습니다.
- 매개 변수 구성 과학: 3.4배의 표준 불량 설정으로 가짜 신호를 효과적으로 필터링할 수 있다.
- 시스템 구조의 명확성: 거래 논리는 간단하고 직관적이며, 유지 및 최적화하기 쉽습니다.
전략적 위험
- 트렌드 브레이크 위험: 강한 트렌드 시장에서, 가격이 지속적으로 부린 대역을 뚫을 수 있으며, 이로 인해 빈번한 정지 손실이 발생할 수 있습니다.
- 불안한 시장 위험: 간격적인 불안한 시기는 거래 비용을 증가시키는 가짜 신호를 너무 많이 생성할 수 있습니다.
- 매개 변수 민감성: 브린 밴드 매개 변수의 미세한 변화는 전략 성능에 큰 영향을 미칠 수 있다.
- 슬라이드 효과: 높은 변동률 환경에서 심각한 슬라이드가 발생할 수 있으며, 이로 인해 전략 성능이 악화됩니다.
- 시간주기 의존성: 전략이 다른 시간주기에 대한 성과에 상당한 차이가 있을 수 있다
전략 최적화 방향
- 다중 시간 주기: 더 긴 주기를 도입한 브린밴드 확인, 신호 신뢰도를 향상
- 트렌드 필터: 트렌드를 판단하는 지표를 추가하고, 트렌드 방향이 명확할 때만 포지션을 개시합니다.
- 동적 변수: 시장의 변동에 따라 적응된 브린 대역 변수
- 스톱 손실 최적화: 트래킹 스톱 또는 ATR 기반의 스톱 손실을 설정하여 풍력 제어 효과를 향상시킵니다.
- 포지션 관리: 신호 강도 및 시장 변동률에 따라 포지션 비율을 동적으로 조정
요약하다
이 전략은 브린 띠 접촉을 통해 시장 역전 기회를 포착하고, 논리적으로 명확하고, 위험을 합리적으로 제어하는 특징이 있다. 합리적인 매개 변수 설정과 완벽한 거래 규칙으로, 전략은 흔들리는 시장에서 좋은 안정성을 보여준다. 그러나 실장 적용 시에는 여전히 트렌드 돌파 위험을 주의해야 하며, 다른 기술 지표와 결합하여 거래를 확인하고, 시장 상태에 따라 전략 매개 변수를 조정하는 것이 좋습니다.
Source
Pine
Strategy parameters
Related strategies
Comment
All comments (0)
No data
- 1