볼린저 밴드 트렌드 돌파 강화된 양적 전략과 지표 모멘텀 필터 시스템 결합

BB RSI EMA ATR RR
생성 날짜: 2024-12-12 14:55:37 마지막으로 수정됨: 2024-12-12 14:55:37
복사: 3 클릭수: 371
avatar of ChaoZhang ChaoZhang
1
집중하다
1617
수행원

볼린저 밴드 트렌드 돌파 강화된 양적 전략과 지표 모멘텀 필터 시스템 결합

개요

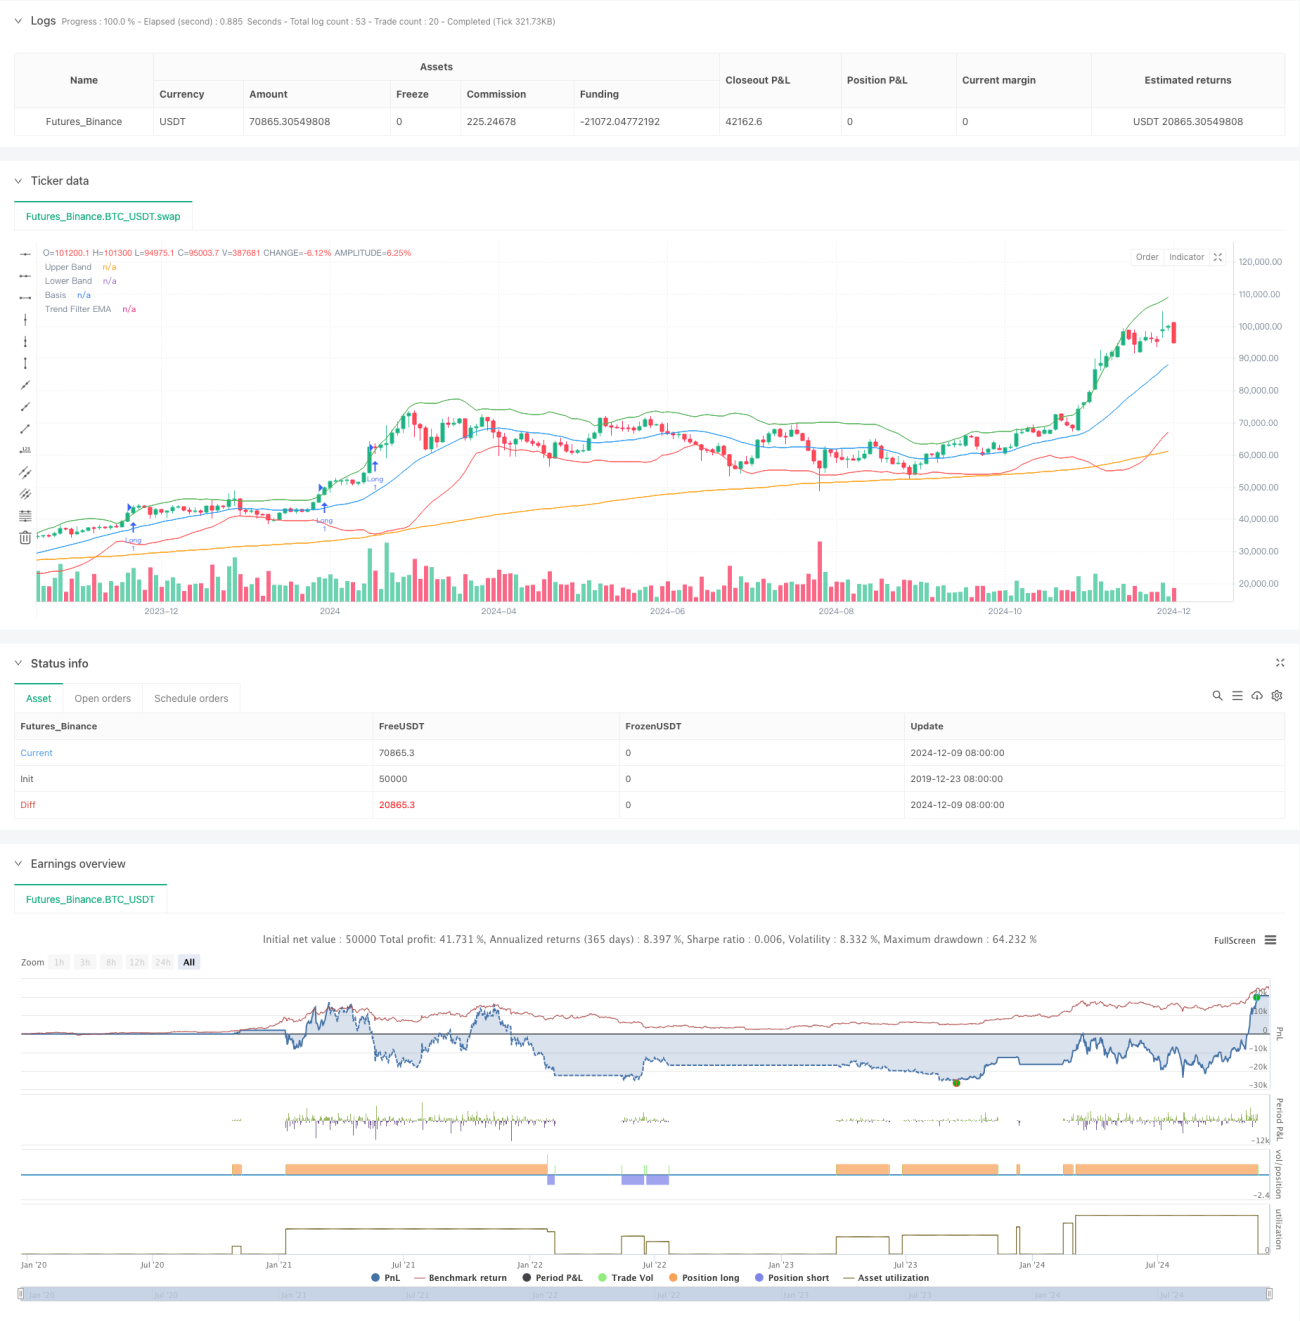
이 전략은 브린 밴드, RSI 지표 및 200주기 EMA 트렌드 필터를 결합한 고급 정량화 거래 시스템입니다. 이 전략은 여러 기술적 지표의 조화를 통해 트렌드 방향에서 높은 확률의 돌파 기회를 포착하고, 파격적인 시장에서 가짜 신호를 효과적으로 필터링합니다.

전략 원칙

이 전략의 핵심 논리는 다음의 세 가지 측면에 기반합니다.

  1. 부린 띠의 돌파 신호: 부린 띠의 상하 궤도를 변동률 통로로 이용, 가격 돌파 상하 궤도는 다중 신호로 간주, 하하 궤도 돌파는 공백 신호로 간주.
  2. RSI 동력 확인: RSI는 50 이상에서 확인하는 다동력하고, 50 이하에서 확인하는 하위동력으로, 트렌드 없는 시간에 거래하는 것을 피한다.
  3. EMA 트렌드 필터: 200주기 EMA를 이용하여 주 트렌드를 판단하고, 트렌드 방향에서만 포지션을 열는다. 가격은 EMA 위에 더하고, 아래에 더空한다.

트랜잭션 확인은 다음을 충족해야 합니다:

  • K선 2개 연속으로 돌파구 상태가 유지되고 있다.
  • 20주기 평균보다 높은 거래량
  • ATR 값에 기반한 동적 정지
  • 이윤 목표값은 1.5배의 리스크/수익비율을 기준으로 설정

전략적 이점

  1. 다중 기술 지표 연동 필터링, 신호 품질을 크게 향상
  2. 동적인 포지션 관리 메커니즘, 시장의 변동에 따라 적응
  3. 엄격한 거래 확인 메커니즘, 가짜 신호를 효과적으로 줄여줍니다.
  4. 역동적인 스톱로즈와 고정된 리스크 수익률을 포함하는 완전한 리스크 제어 시스템
  5. 다양한 시장 환경에 적응할 수 있는 유연한 변수 최적화 공간

전략적 위험

  1. 과도한 매개변수 최적화는 과적합으로 이어질 수 있습니다.
  2. 시장의 급격한 변동으로 인해 빈번한 손실이 발생할 수 있습니다.
  3. 시장의 흔들림으로 인해 지속적인 손실이 발생할 수 있습니다.
  4. 트렌드 전환점 신호 지연
  5. 기술 지표들 사이에 모순된 신호가 있을 수 있습니다.

위험 관리 제안:

  • 단호한 제재 규율이 적용됩니다.
  • 단편 거래 위험을 조절합니다.
  • 주기적으로 재검토하여 변수의 유효성을 검증한다.
  • 기본적 분석과 함께
  • 과도한 거래를 피하십시오.

전략 최적화 방향

  1. 더 많은 기술 지표를 도입하고 상호 검증
  2. 적응 변수 최적화 메커니즘 개발
  3. 시장 감정 지표 추가
  4. 거래 확인 메커니즘을 최적화합니다.
  5. 더 유연한 포지션 관리 시스템을 개발

주요 최적화 아이디어:

  • 다른 시장 주기의 동적에 따라 조정 변수
  • 트랜잭션 필터링 조건을 추가
  • 최적화된 리스크/이익 비율 설정
  • 손해제도 개선
  • 더 똑똑한 신호 확인 시스템 개발

요약하다

이 전략은 부린 띠, RSI, EMA 등의 기술 지표의 유기적 결합을 통해 완전한 거래 시스템을 구축한다. 시스템은 거래 품질을 보장하면서 엄격한 위험 제어와 유연한 파라미터 최적화 공간을 통해 강력한 실전 응용 가치를 보여줍니다. 거래자는 실제에서 신중하게 파라미터를 검증하고, 거래 규율을 엄격하게 시행하고, 전략 성능을 지속적으로 최적화하도록 권장한다.

전략 소스 코드
/*backtest
start: 2019-12-23 08:00:00
end: 2024-12-10 08:00:00
period: 2d
basePeriod: 2d
exchanges: [{"eid":"Futures_Binance","currency":"BTC_USDT"}]
*/

//@version=5
strategy("Improved Bollinger Breakout with Trend Filtering", overlay=true)

// === Inputs ===
length = input(20, title="Bollinger Bands Length", tooltip="The number of candles used to calculate the Bollinger Bands. Higher values smooth the bands, lower values make them more reactive.")
mult = input(2.0, title="Bollinger Bands Multiplier", tooltip="Controls the width of the Bollinger Bands. Higher values widen the bands, capturing more price movement.")
rsi_length = input(14, title="RSI Length", tooltip="The number of candles used to calculate the RSI. Shorter lengths make it more sensitive to recent price movements.")
rsi_midline = input(50, title="RSI Midline", tooltip="Defines the midline for RSI to confirm momentum. Higher values make it stricter for bullish conditions.")
risk_reward_ratio = input(1.5, title="Risk/Reward Ratio", tooltip="Determines the take-profit level relative to the stop-loss.")
atr_multiplier = input(1.5, title="ATR Multiplier for Stop-Loss", tooltip="Defines the distance of the stop-loss based on ATR. Higher values set wider stop-losses.")
volume_filter = input(true, title="Enable Volume Filter", tooltip="If enabled, trades will only execute when volume exceeds the 20-period average.")
trend_filter_length = input(200, title="Trend Filter EMA Length", tooltip="The EMA length used to filter trades based on the market trend.")
trade_direction = input.string("Both", title="Trade Direction", options=["Long", "Short", "Both"], tooltip="Choose whether to trade only Long, only Short, or Both directions.")
confirm_candles = input(2, title="Number of Confirming Candles", tooltip="The number of consecutive candles that must meet the conditions before entering a trade.")

// === Indicator Calculations ===
basis = ta.sma(close, length)
dev = mult * ta.stdev(close, length)
upper_band = basis + dev
lower_band = basis - dev
rsi_val = ta.rsi(close, rsi_length)
atr_val = ta.atr(14)
vol_filter = volume > ta.sma(volume, 20)
ema_trend = ta.ema(close, trend_filter_length)

// === Helper Function for Confirmation ===
confirm_condition(cond, lookback) =>
    count = 0
    for i = 0 to lookback - 1
        count += cond[i] ? 1 : 0
    count == lookback

// === Trend Filter ===
trend_is_bullish = close > ema_trend
trend_is_bearish = close < ema_trend

// === Long and Short Conditions with Confirmation ===
long_raw_condition = close > upper_band * 1.01 and rsi_val > rsi_midline and (not volume_filter or vol_filter) and trend_is_bullish
short_raw_condition = close < lower_band * 0.99 and rsi_val < rsi_midline and (not volume_filter or vol_filter) and trend_is_bearish

long_condition = confirm_condition(long_raw_condition, confirm_candles)
short_condition = confirm_condition(short_raw_condition, confirm_candles)

// === Trade Entry and Exit Logic ===
if long_condition and (trade_direction == "Long" or trade_direction == "Both")
    strategy.entry("Long", strategy.long)
    strategy.exit("Exit Long", "Long", stop=close - (atr_multiplier * atr_val), limit=close + (atr_multiplier * risk_reward_ratio * atr_val))

if short_condition and (trade_direction == "Short" or trade_direction == "Both")
    strategy.entry("Short", strategy.short)
    strategy.exit("Exit Short", "Short", stop=close + (atr_multiplier * atr_val), limit=close - (atr_multiplier * risk_reward_ratio * atr_val))

// === Plotting ===
plot(upper_band, color=color.green, title="Upper Band")
plot(lower_band, color=color.red, title="Lower Band")
plot(basis, color=color.blue, title="Basis")
plot(ema_trend, color=color.orange, title="Trend Filter EMA")