개요
이 전략은 평균선, 운동, 그리고 충격 지표를 결합한 통합 거래 시스템이다. 이 전략은 이동 평균의 수렴 분산 지표 ((MACD), 지수 이동 평균 ((EMA) 및 상대적으로 강한 지표 ((RSI) 의 조화 작용을 통해 시장 추세가 명확하고 충분한 동력을 가진 경우에 거래한다. 이 전략은 주로 상승 추세에 초점을 맞추고, 다중 기술 지표의 교차 검증을 통해 거래의 신호 신뢰성을 보장한다.
전략 원칙
이 전략은 트레이드 시기를 결정하기 위해 세 가지 필터링 메커니즘을 사용합니다.
- 트렌드 확인: 200일 지수 이동 평균 ((EMA200) 을 트렌드 필터로 사용하며, 가격이 EMA200 위에 있을 때만 추가로 고려한다.
- 동력 확인: MACD 지표 ((변수: 빠른 선 12, 느린 선 26, 신호 선 9) 를 통해 시장 동력을 판단하고, MACD 선이 신호 선 위에 있어야 한다.
- 변동 확인: RSI 지표 ((변수 14로) 를 사용하여 과매매 판단을 하고, RSI가 50-70 범위 내에 있어야 한다.
평점 조건은 다음과 같은 조건 중 하나만 충족하면 트리거할 수 있습니다.
- MACD 라인은 신호 라인을 넘어갑니다.
- 가격 하락: EMA200
- RSI가 70을 넘어서서 오버 바이 지역으로 들어갑니다.
전략적 이점
- 여러 가지 확인 메커니즘은 가짜 신호의 영향을 크게 줄이고 거래의 신뢰성을 높였습니다.
- 트렌드와 동력 지표의 결합으로 큰 트렌드를 파악하고, 단기 기회도 놓치지 않습니다.
- RSI를 사용하여 보조 필터링을 수행하여 추격 위험을 효과적으로 피할 수 있습니다.
- 전략 논리가 명확하고, 매개 변수가 조정 가능하며, 다양한 시장 환경에 적합하다.
- 지분 관리를 적용하여 장기적인 자금 성장에 도움이 됩니다.
전략적 위험
- 너무 많은 필터링 조건으로 인해 수익 기회를 놓칠 수 있습니다.
- 불안한 시장에서, 빈번한 가짜 돌파는 연속적인 손실을 초래할 수 있다.
- EMA200은 추세 지표로서 느리게 반응할 수 있으며, 시장이 급격하게 변하면 손실이 더 크다.
- 하지만, 이 경우, 이 경우, 이 경우, 이 경우, 이 경우.
전략 최적화 방향
- 적응 변수를 입력하세요:
- 시장의 변동에 따라 MACD 변수를 동적으로 조정
- ATR 지표를 사용하여 중지 손실 설정을 최적화하십시오.
- 위험 관리:
- 트래킹을 멈추기 위한 기능 추가
- 최대 회수 제한을 설정
- 진입 타이밍 최적화:
- 수량 확인 메커니즘에 가입
- 가격 형태 분석을 고려하세요.
- 포지션 관리 개선:
- 변동율에 따라 역동적으로 조정된 지분 비율
- 배치별로 위치를 구축하고 축소하기 위한 메커니즘을 구현합니다.
요약하다
이 전략은 여러 가지 기술 지표를 통합하여 비교적 안정적인 거래 시스템을 구축한다. 전략의 핵심 장점은 거짓 신호의 영향을 효과적으로 줄일 수 있는 여러 가지 확인 메커니즘에 있다. 합리적인 최적화와 위험 통제의 개선을 통해 이 전략은 다양한 시장 환경에서 안정적인 성능을 유지할 수 있을 것으로 보인다.
전략 소스 코드
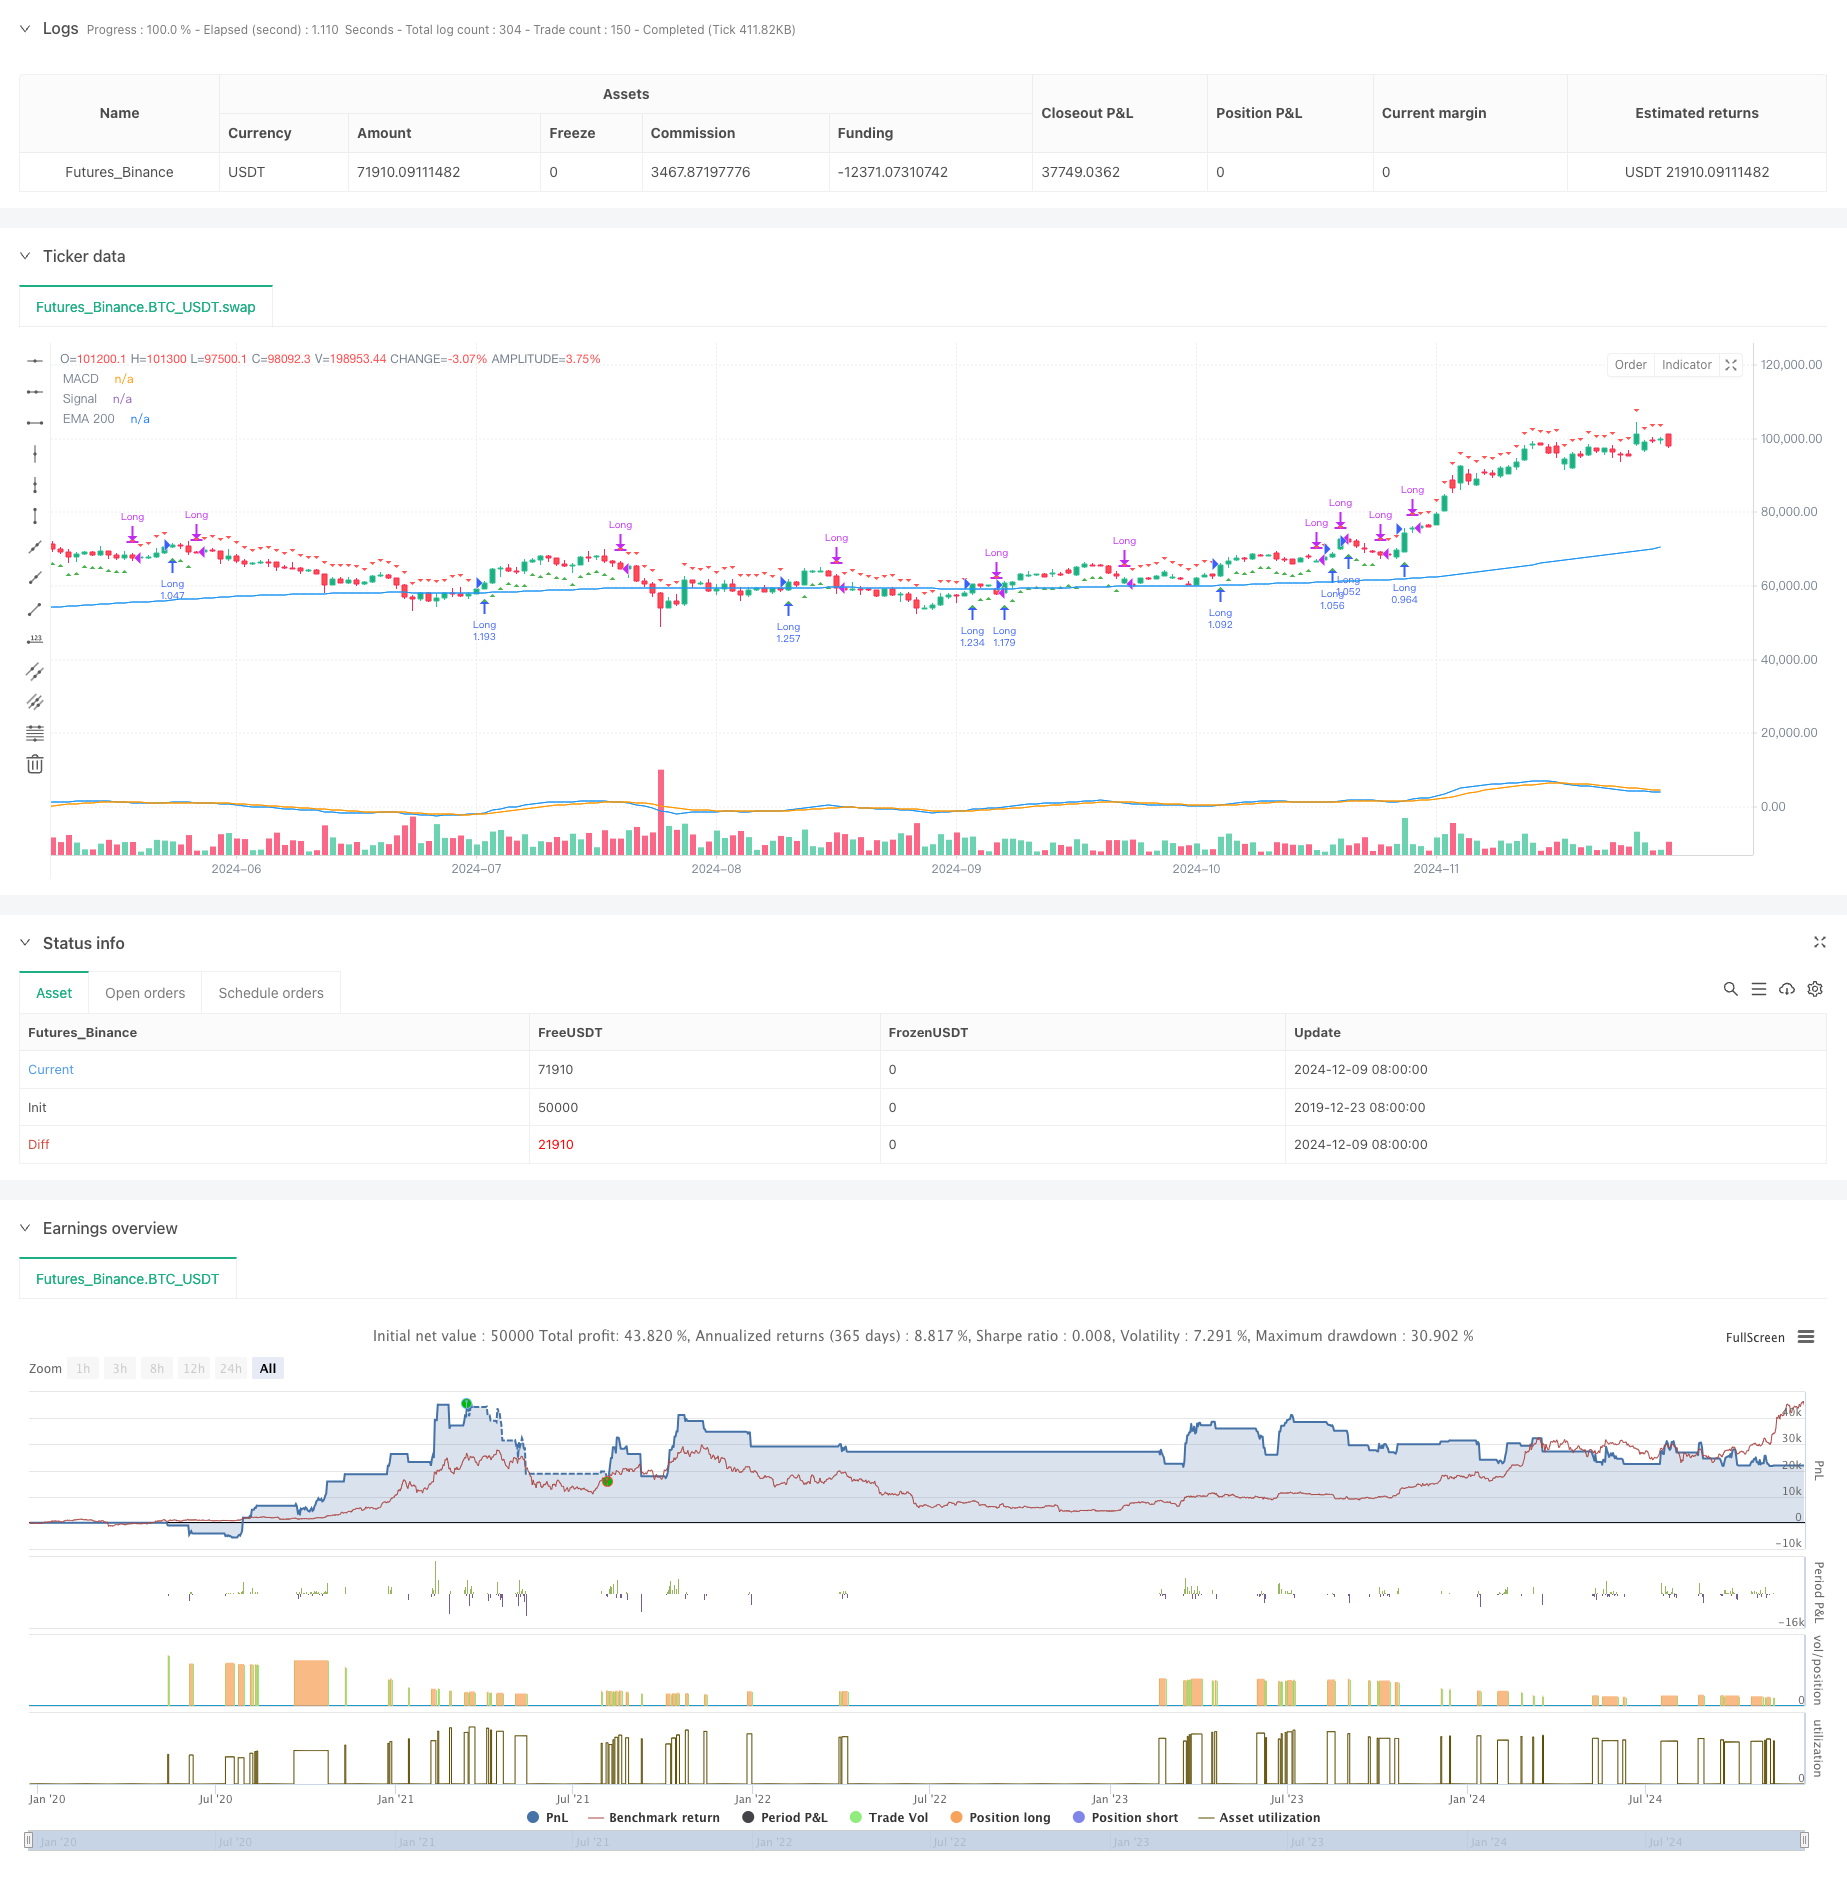
/*backtest
start: 2019-12-23 08:00:00
end: 2024-12-10 08:00:00
period: 1d
basePeriod: 1d
exchanges: [{"eid":"Futures_Binance","currency":"BTC_USDT"}]
*/

//@version=5
strategy("Simplified SOL/USDT Strategy", overlay=true, initial_capital=10000, default_qty_type=strategy.percent_of_equity, default_qty_value=100)

// Input parameters
fast_length = input(12, "MACD Fast Length")
slow_length = input(26, "MACD Slow Length")
signal_length = input(9, "MACD Signal Length")
ema_length = input(200, "EMA Length")
rsi_length = input(14, "RSI Length")

// Calculate indicators
[macd, signal, hist] = ta.macd(close, fast_length, slow_length, signal_length)
ema200 = ta.ema(close, ema_length)
rsi = ta.rsi(close, rsi_length)

// Entry conditions
long_entry = close > ema200 and
             macd > signal and
             rsi > 50 and rsi < 70

// Exit conditions
long_exit = macd < signal or close < ema200 or rsi > 70

// Strategy execution
if (long_entry)
    strategy.entry("Long", strategy.long)

if (long_exit)
    strategy.close("Long")

// Plot indicators
plot(ema200, color=color.blue, title="EMA 200")
plot(macd, color=color.blue, title="MACD")
plot(signal, color=color.orange, title="Signal")

// Plot entry and exit points
plotshape(long_entry, title="Long Entry", location=location.belowbar, color=color.green, style=shape.triangleup, size=size.small)
plotshape(long_exit, title="Long Exit", location=location.abovebar, color=color.red, style=shape.triangledown, size=size.small)