
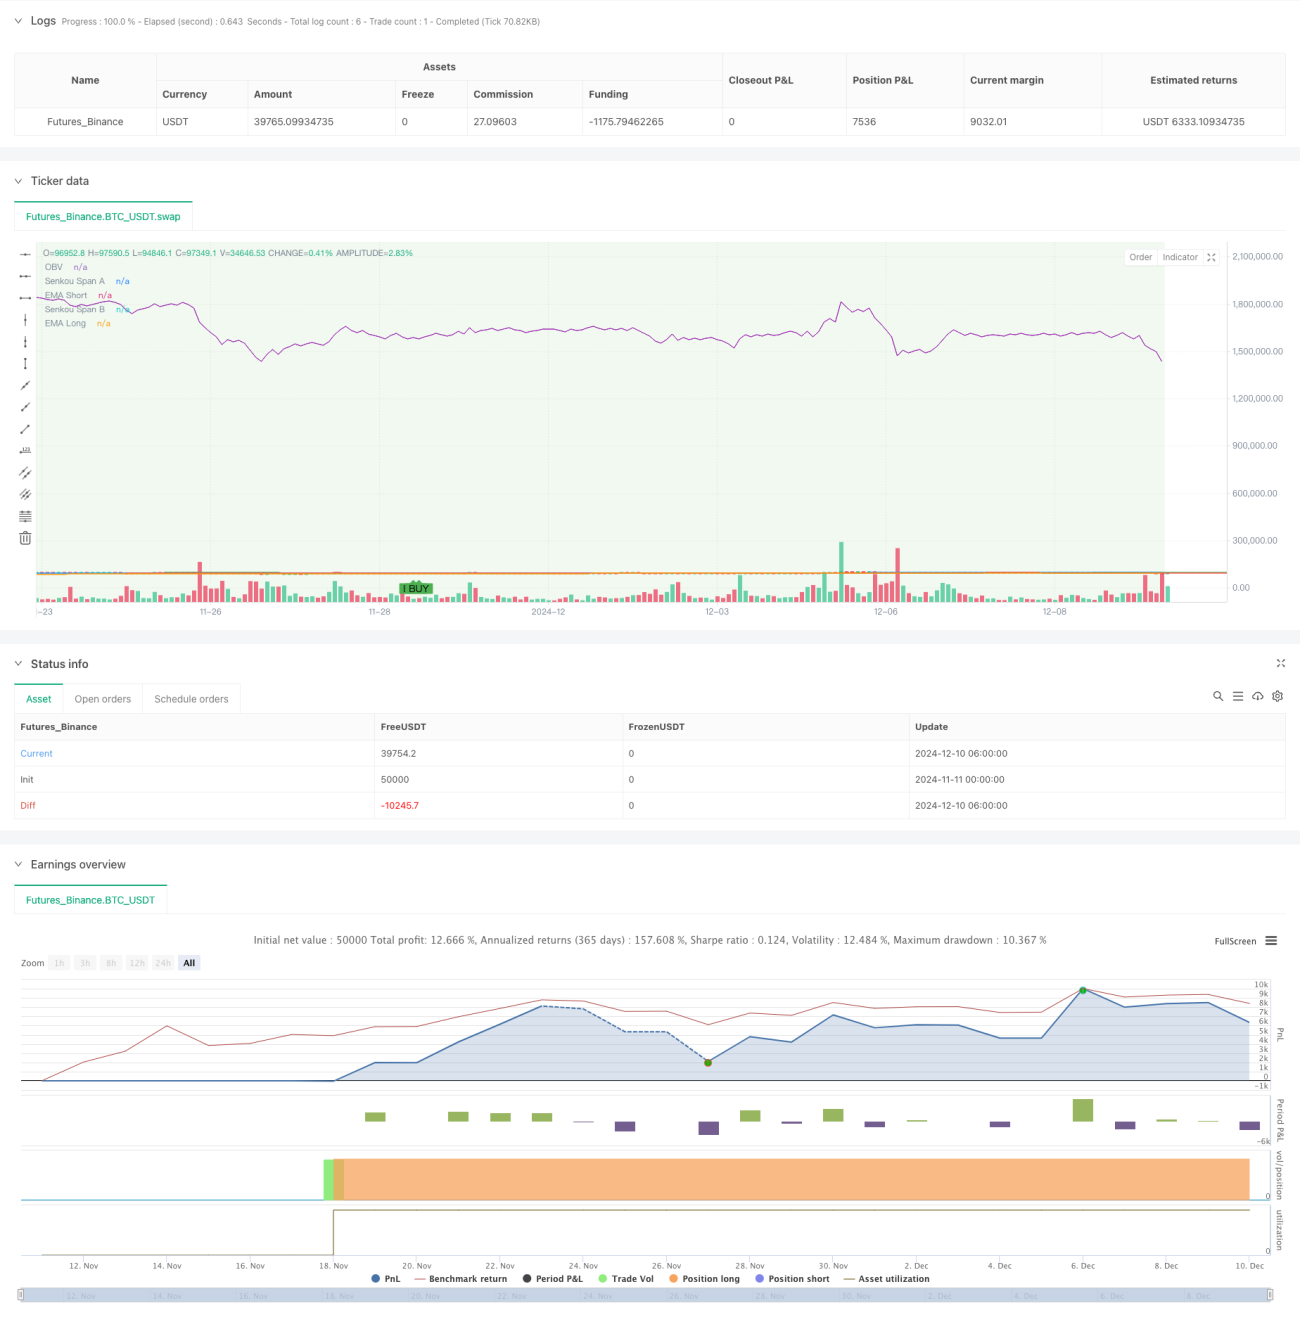
이것은 여러 기술 지표의 트렌드 추적과 변동의 돌파구를 결합한 전략이다. 이 전략은 평행선 시스템 ((EMA), 트렌드 강도 지표 ((ADX), 시장 변동 지표 ((ATR), 가격 분석 ((OBV) 과 이치모쿠 클라우드 그래프 및 무작위 지표 ((Stochastic) 와 같은 보조 지표를 통합하여 시장의 추세와 돌파구를 포착합니다. 전략은 거래 효율성을 높이기 위해 엄격한 시간 필터를 설정하여 특정 거래 시간 내에만 작동합니다.
이 전략의 핵심 논리는 다층적 기술 지표의 통합된 판단에 기반합니다.
이 전략은 다음과 같은 조건이 충족되면 구매 신호를 발송합니다.
위험 관리 제안:
이 전략은 여러 가지 기술 지표를 통합하여 전체적인 거래 시스템을 구축한다. 전략의 장점은 여러 계층의 지표 교차 검증과 엄격한 위험 제어에 있습니다. 그러나 동시에 매개 변수 최적화 및 신호 지연과 같은 도전에 직면합니다. 지속적인 최적화 및 개선으로 전략은 다양한 시장 환경에서 안정적인 성능을 유지할 것으로 예상됩니다.
/*backtest
start: 2024-11-11 00:00:00
end: 2024-12-10 08:00:00
period: 2h
basePeriod: 2h
exchanges: [{"eid":"Futures_Binance","currency":"BTC_USDT"}]
*/
//@version=5
strategy("Khaleq Strategy Pro - Fixed Version", overlay=true)
// === Input Settings ===
ema_short = input.int(50, "EMA Short", minval=1)
ema_long = input.int(200, "EMA Long", minval=1)
adx_threshold = input.int(25, "ADX Threshold", minval=1)
atr_multiplier = input.float(2.0, "ATR Multiplier", minval=0.1)
time_filter_start = input(timestamp("0000-01-01 09:00:00"), "Trading Start Time", group="Time Filter")
time_filter_end = input(timestamp("0000-01-01 17:00:00"), "Trading End Time", group="Time Filter")
// === Ichimoku Settings ===
tenkan_len = 9
kijun_len = 26
senkou_span_b_len = 52
displacement = 26
// === Calculations ===
// Ichimoku Components
tenkan_sen = (ta.highest(high, tenkan_len) + ta.lowest(low, tenkan_len)) / 2
kijun_sen = (ta.highest(high, kijun_len) + ta.lowest(low, kijun_len)) / 2
senkou_span_a = (tenkan_sen + kijun_sen) / 2
senkou_span_b = (ta.highest(high, senkou_span_b_len) + ta.lowest(low, senkou_span_b_len)) / 2
// EMA Calculations
ema_short_val = ta.ema(close, ema_short)
ema_long_val = ta.ema(close, ema_long)
// Manual ADX Calculation
length = 14
dm_plus = math.max(ta.change(high), 0)
dm_minus = math.max(-ta.change(low), 0)
tr = math.max(high - low, math.max(math.abs(high - close[1]), math.abs(low - close[1])))
tr14 = ta.sma(tr, length)
dm_plus14 = ta.sma(dm_plus, length)
dm_minus14 = ta.sma(dm_minus, length)
di_plus = (dm_plus14 / tr14) * 100
di_minus = (dm_minus14 / tr14) * 100
dx = math.abs(di_plus - di_minus) / (di_plus + di_minus) * 100
adx_val = ta.sma(dx, length)
// ATR Calculation
atr_val = ta.atr(14)
// Stochastic RSI Calculation
k = ta.stoch(close, high, low, 14)
d = ta.sma(k, 3)
// Time Filter
is_within_time = true
// Support and Resistance (High and Low Levels)
resistance_level = ta.highest(high, 20)
support_level = ta.lowest(low, 20)
// Volume Analysis (On-Balance Volume)
vol_change = ta.change(close)
obv = ta.cum(vol_change > 0 ? volume : vol_change < 0 ? -volume : 0)
// === Signal Conditions ===
buy_signal = is_within_time and
(close > ema_short_val) and
(ema_short_val > ema_long_val) and
(adx_val > adx_threshold) and
(close > senkou_span_a) and
(k < 20) // Stochastic oversold
sell_signal = is_within_time and
(close < ema_short_val) and
(ema_short_val < ema_long_val) and
(adx_val > adx_threshold) and
(close < senkou_span_b) and
(k > 80) // Stochastic overbought
// === Plotting ===
// Plot Buy and Sell Signals
plotshape(buy_signal, color=color.green, style=shape.labelup, title="Buy Signal", location=location.belowbar, text="BUY")
plotshape(sell_signal, color=color.red, style=shape.labeldown, title="Sell Signal", location=location.abovebar, text="SELL")
// Plot EMAs
plot(ema_short_val, color=color.blue, title="EMA Short")
plot(ema_long_val, color=color.orange, title="EMA Long")
// Plot Ichimoku Components
plot(senkou_span_a, color=color.green, title="Senkou Span A", offset=displacement)
plot(senkou_span_b, color=color.red, title="Senkou Span B", offset=displacement)
// // Plot Support and Resistance using lines
// var line resistance_line = na
// var line support_line = na
// if bar_index > 1
// line.delete(resistance_line)
// line.delete(support_line)
// resistance_line := line.new(x1=bar_index - 1, y1=resistance_level, x2=bar_index, y2=resistance_level, color=color.red, width=1, style=line.style_dotted)
// support_line := line.new(x1=bar_index - 1, y1=support_level, x2=bar_index, y2=support_level, color=color.green, width=1, style=line.style_dotted)
// Plot OBV
plot(obv, color=color.purple, title="OBV")
// Plot Background for Trend (Bullish/Bearish)
bgcolor(close > ema_long_val ? color.new(color.green, 90) : color.new(color.red, 90), title="Trend Background")
// === Alerts ===
alertcondition(buy_signal, title="Buy Alert", message="Buy Signal Triggered")
alertcondition(sell_signal, title="Sell Alert", message="Sell Signal Triggered")
// === Strategy Execution ===
if buy_signal
strategy.entry("Buy", strategy.long)
if sell_signal
strategy.close("Buy")
strategy.exit("Sell", "Buy", stop=close - atr_multiplier * atr_val, limit=close + atr_multiplier * atr_val)