
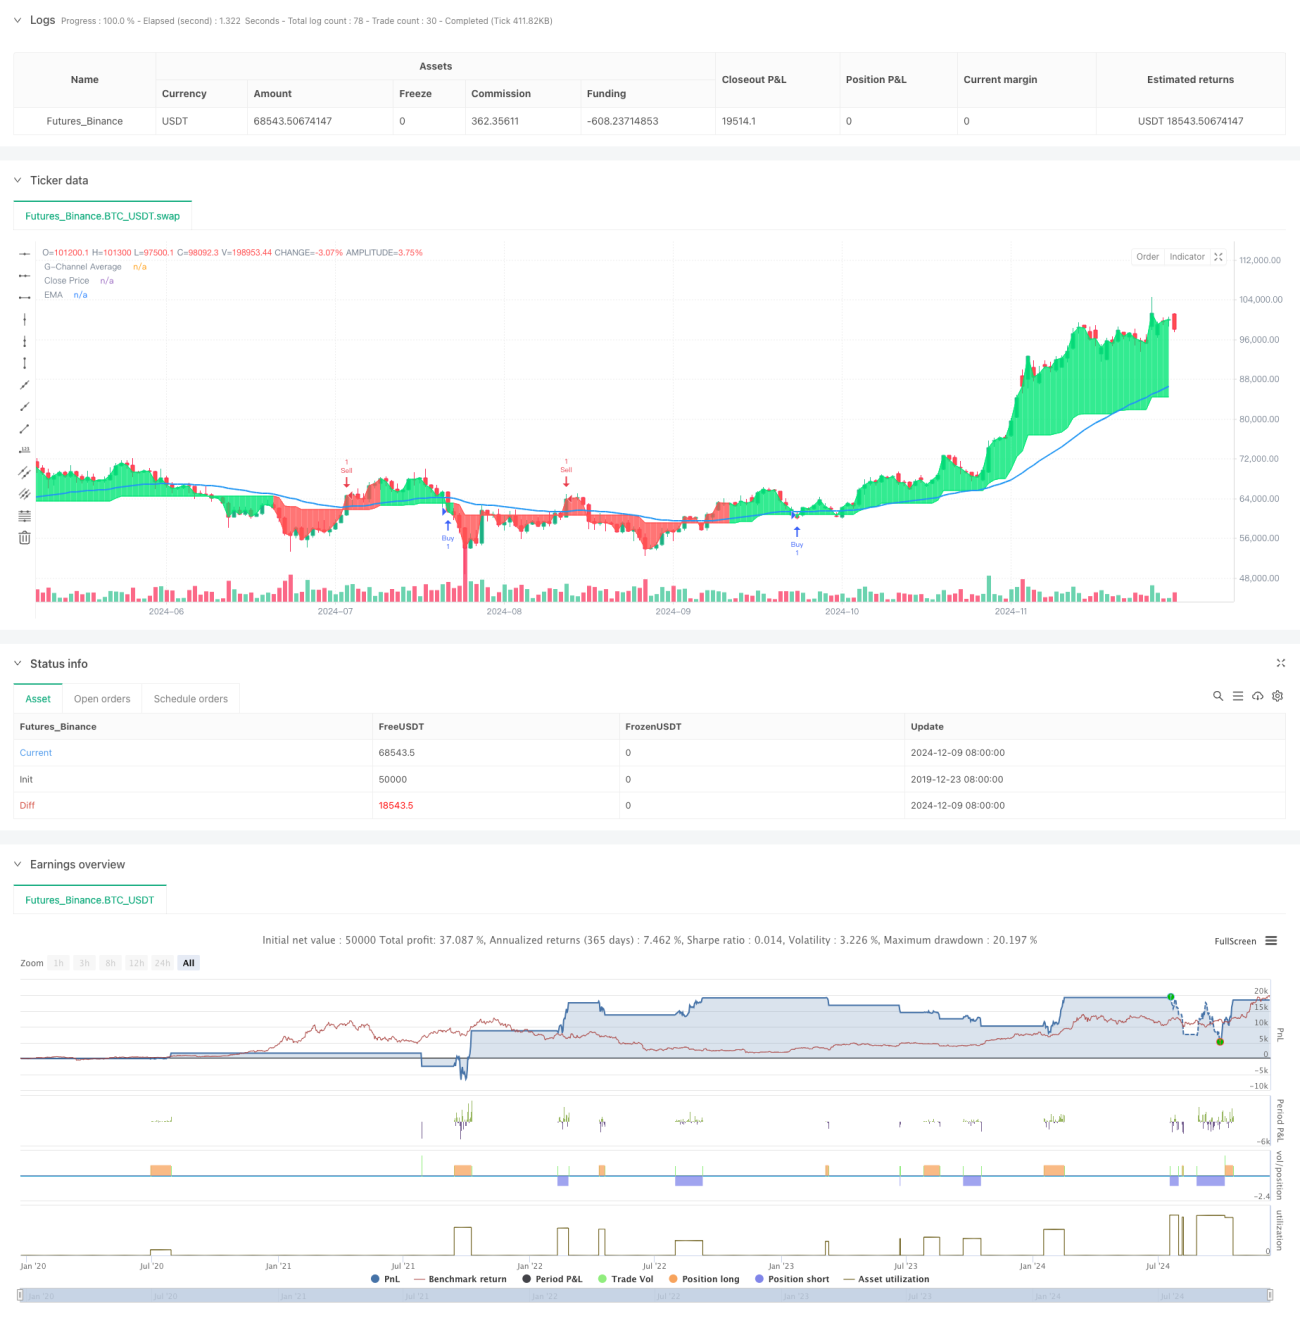
이 전략은 G 채널 (G-Channel), 지수 이동 평균 (EMA) 및 실제 변동의 폭 (ATR) 을 결합한 다중 지표 거래 시스템이다. 그것은 동적 지원/저항 지점과 트렌드 확인을 통해 거래 신호를 식별하고 ATR 기반의 스톱과 스톱을 사용하여 위험을 관리한다. 시스템 설계는 신뢰성과 위험 제어에 중점을 두고 있으며, 안정적인 거래 방법을 찾는 거래자에게 적합하다.
이 전략의 핵심 논리는 다음과 같은 몇 가지 핵심 요소에 기반합니다.
이 전략은 여러 정교한 기술 지표를 조합하여 하나의 완전한 거래 시스템을 구축한다. 시스템의 장점은 다층적인 신호 확인 메커니즘과 변동률 기반의 위험 관리에 있다. 그러나 실제 응용에서는 특정 시장 특성에 따라 최적화가 필요하다. 제안된 최적화 방향은 전략의 안정성과 적응성을 더욱 높일 수 있다.
/*backtest
start: 2019-12-23 08:00:00
end: 2024-12-10 08:00:00
period: 1d
basePeriod: 1d
exchanges: [{"eid":"Futures_Binance","currency":"BTC_USDT"}]
*/
//@version=5
strategy("G-Channel with EMA Strategy and ATR SL/TP", shorttitle="G-EMA-ATR", overlay=true)
// Input parameters
length = input.int(100, title="G-Channel Length")
src = input.source(close, title="Source")
ema_length = input.int(50, title="EMA Length") // EMA length
atr_length = input.int(14, title="ATR Length") // ATR length
// G-Channel calculation
var float a = na
var float b = na
a := math.max(src, nz(a[1])) - nz(a[1] - b[1]) / length
b := math.min(src, nz(b[1])) + nz(a[1] - b[1]) / length
avg = (a + b) / 2
// G-Channel cross conditions
crossup = b[1] < close[1] and b > close
crossdn = a[1] < close[1] and a > close
bullish = ta.barssince(crossdn) <= ta.barssince(crossup)
c = bullish ? color.lime : color.red
// EMA calculation
ema_value = ta.ema(src, ema_length)
// ATR calculation
atr_value = ta.atr(atr_length)
// Plot G-Channel average and Close price
p1 = plot(avg, "G-Channel Average", color=c, linewidth=1, transp=90)
p2 = plot(close, "Close Price", color=c, linewidth=1, transp=100)
fill(p1, p2, color=c, transp=90)
// Plot EMA
plot(ema_value, color=color.blue, linewidth=2, title="EMA")
// Buy and Sell conditions
buy_condition = bullish and close < ema_value
sell_condition = not bullish and close > ema_value
// Track the last signal state
var bool last_was_buy = false
var bool last_was_sell = false
// ATR-based SL and TP calculations
long_sl = close - 2 * atr_value // 2 ATR below the entry for SL
long_tp = close + 4 * atr_value // 4 ATR above the entry for TP
short_sl = close + 2 * atr_value // 2 ATR above the entry for SL (short)
short_tp = close - 4 * atr_value // 4 ATR below the entry for TP (short)
// Generate Buy signal only if the last signal was not Buy
if (buy_condition and not last_was_buy)
strategy.entry("Buy", strategy.long)
strategy.exit("Exit Buy", from_entry="Buy", stop=long_sl, limit=long_tp)
last_was_buy := true
last_was_sell := false
// Generate Sell signal only if the last signal was not Sell
if (sell_condition and not last_was_sell)
strategy.entry("Sell", strategy.short)
strategy.exit("Exit Sell", from_entry="Sell", stop=short_sl, limit=short_tp)
last_was_sell := true
last_was_buy := false
// Plot shapes for Buy and Sell signals
plotshape(series=buy_condition and not last_was_buy, location=location.belowbar, style=shape.labelup, color=color.lime, size=size.small, text="Buy", textcolor=color.white)
plotshape(series=sell_condition and not last_was_sell, location=location.abovebar, style=shape.labeldown, color=color.red, size=size.small, text="Sell", textcolor=color.white)