ATR 기반의 동적 트레일링 스톱로스 트레이딩 전략

1
Follow
1781
Followers
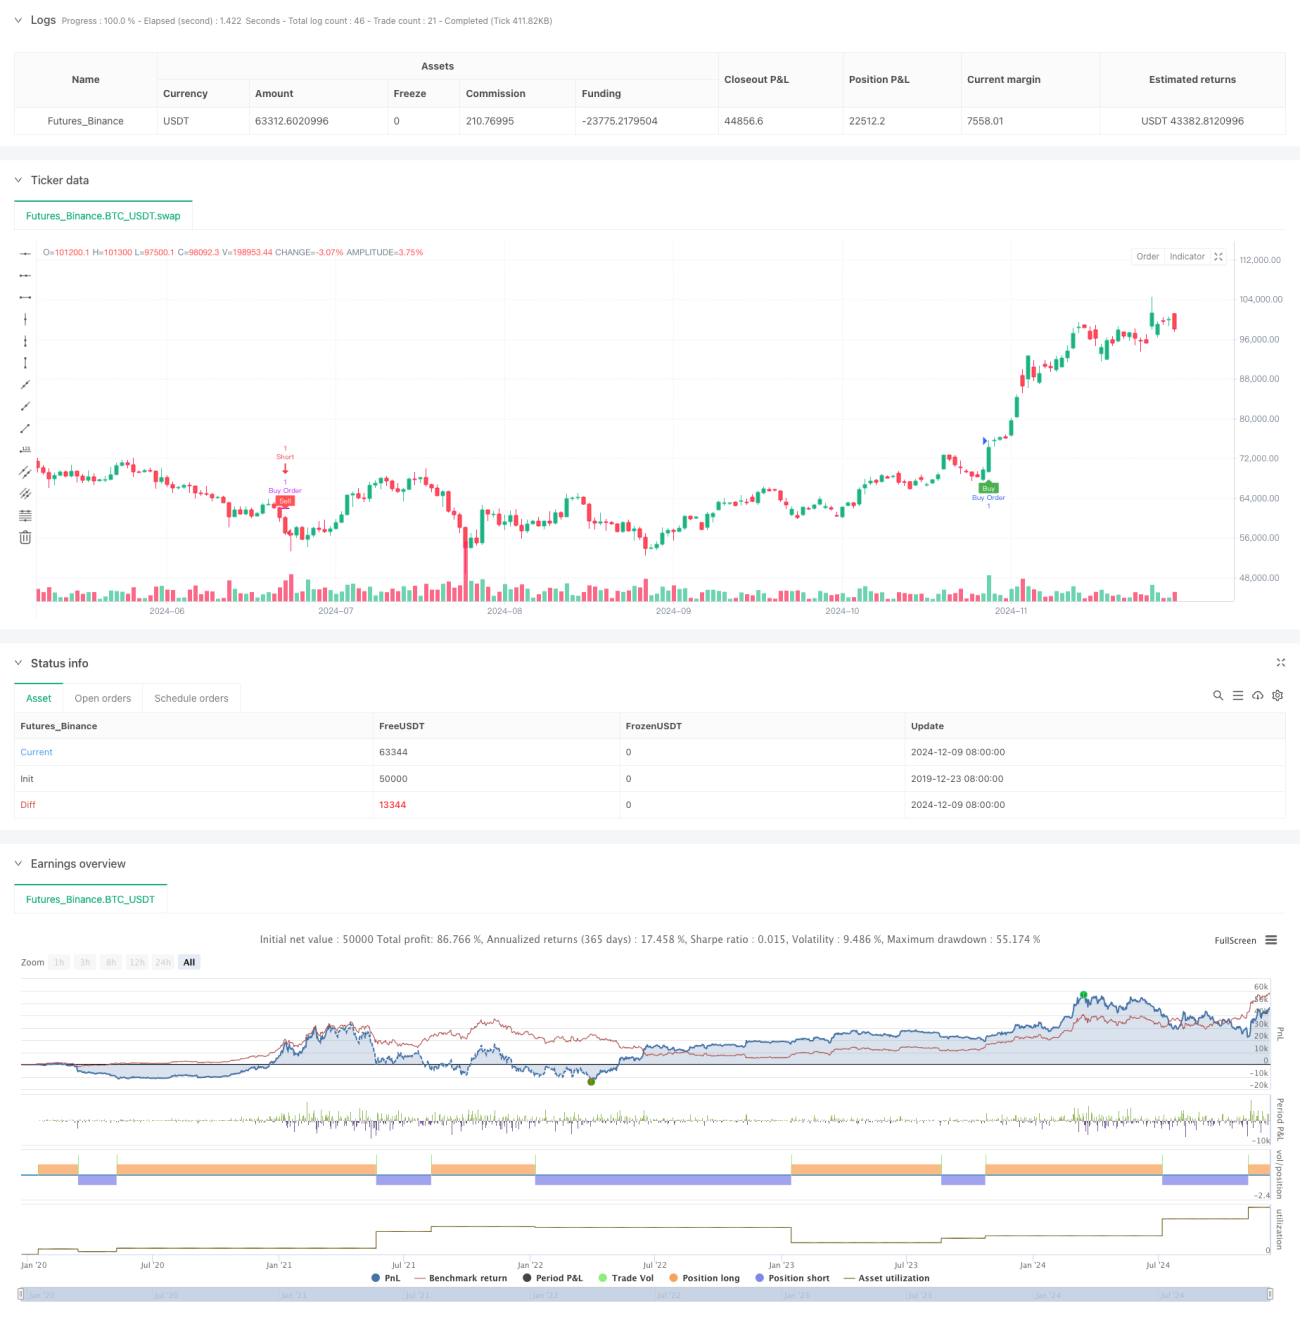
개요
이 전략은 ATR ((평균 실제 파도) 지표에 기반한 동적 추적 중지 전략이다. ATR 값을 통해 동적으로 중지 위치를 조정하고 EMA 평준과 결합하여 거래 신호를 확인한다. 전략은 유연한 포지션 관리를 지원하며, 다른 시장 환경과 거래 품종에 따라 주문 구매 판매 수를 할 수 있다.
전략 원칙
전략의 핵심 논리는 다음과 같은 핵심 요소에 기초합니다.
- ATR 지표를 사용하여 시장의 변동률을 계산하고 사용자 정의 인수와 함께 스톱 거리 조정
- 동적 추적 스톱 라인을 설정하여 가격 변화에 따라 자동으로 조정됩니다.
- 거래 신호를 확인하기 위해 EMA 평균선과 트래킹 스톱 라인의 교차
- 거래 신호는 가격의 스톱 라인을 뚫고 EMA가 확인했을 때 생성됩니다.
- 포지션 관리 시스템으로 거래 수를 제어하고 포트폴리오 상태를 실시간으로 추적합니다.
전략적 이점
- 자기 적응성 - ATR 지표는 시장의 변동에 따라 자동으로 중지 거리를 조정하여 전략이 다양한 시장 환경에서 좋은 성과를 유지할 수 있도록합니다.
- 리스크 관리가 잘 되어 있습니다. 동적 추적 스톱 메커니즘은 이미 벌어들인 수익을 효과적으로 보호하고 잠재적인 손실을 제한합니다.
- 동작의 유연성 - 사용자 정의 거래 수와 ATR 파라미터를 지원하여 다른 거래 품종의 특성에 따라 최적화 할 수 있습니다.
- 신호 신뢰성 - EMA 통일 라인 확인으로 가짜 신호의 영향을 줄인다
- 완전 자동화 - 전략이 완전히 자동화되어 인간의 정서적 방해를 줄일 수 있습니다.
전략적 위험
- 흔들림 시장 위험 - 가로판 흔들림 시장에서 과도한 거래로 이어지는 빈번한 가짜 브레이크 신호가 발생할 수 있습니다.
- 슬라이드 포인트 위험 - 빠른 상황에서 전략에 영향을 미치는 큰 슬라이드 포인트가 발생할 수 있습니다.
- 매개 변수 민감성 - ATR 주기 및 계수의 선택이 전략 성능에 큰 영향을 미칩니다.
- 자금 관리 위험 - 거래 수를 적절하게 설정하지 않으면 과도한 레버리지 위험이 발생할 수 있습니다.
- 시장의 변동 위험 - 급격한 변동이 있을 때 단숨에 스톱포드가 깨질 수 있습니다.
전략 최적화 방향
- 시장 환경 식별 메커니즘을 도입하여 다른 시장 상태에서 다른 파라미터 조합을 사용합니다.
- 거래량 요소를 추가하여 거래 신호의 신뢰성을 높이는 신호 필터링 조건
- 자본 관리 알고리즘을 최적화하여 변동률에 따라 지분 규모를 조정합니다.
- 시간 필터링 메커니즘을 추가하여 거래에 부적절한 시간에 거래를 방지합니다.
- 역동적으로 변수를 조정할 수 있는 적응형 변수 최적화 시스템을 개발
요약하다
이 전략은 ATR 지표와 EMA 평행선을 결합하여 신뢰할 수 있는 동적 추적 스톱 손실 시스템을 구축한다. 그것의 장점은 시장의 변동에 적응할 수 있고, 완벽한 위험 관리 메커니즘을 가지고 있으며, 동시에 동작의 유연성을 유지한다는 것이다. 일부 고유한 위험이 존재하지만, 지속적인 최적화 및 개선으로, 전략은 다양한 시장 환경에서 안정적인 성능을 유지할 수 있을 것으로 보인다. 거래자는 실장 사용 전에 여러 가지 요소 조합을 충분히 테스트하고, 특정 거래 품종의 특성에 따라 타깃적 최적화를 수행하는 것이 좋습니다.
Source
Pine
/*backtest
start: 2019-12-23 08:00:00
end: 2024-12-10 08:00:00
period: 1d
basePeriod: 1d
exchanges: [{"eid":"Futures_Binance","currency":"BTC_USDT"}]
*/

//@version=5
strategy(title='ADET GİRMELİ Trend İz Süren Stop Strategy', overlay=true, overlay=true,default_qty_type = strategy.fixed, default_qty_value = 1)

// InputsStrategy parameters
Related strategies
Comment
All comments (0)
No data
- 1