다중 기간 추세 동적 변동성 추적 전략

1
Follow
1781
Followers
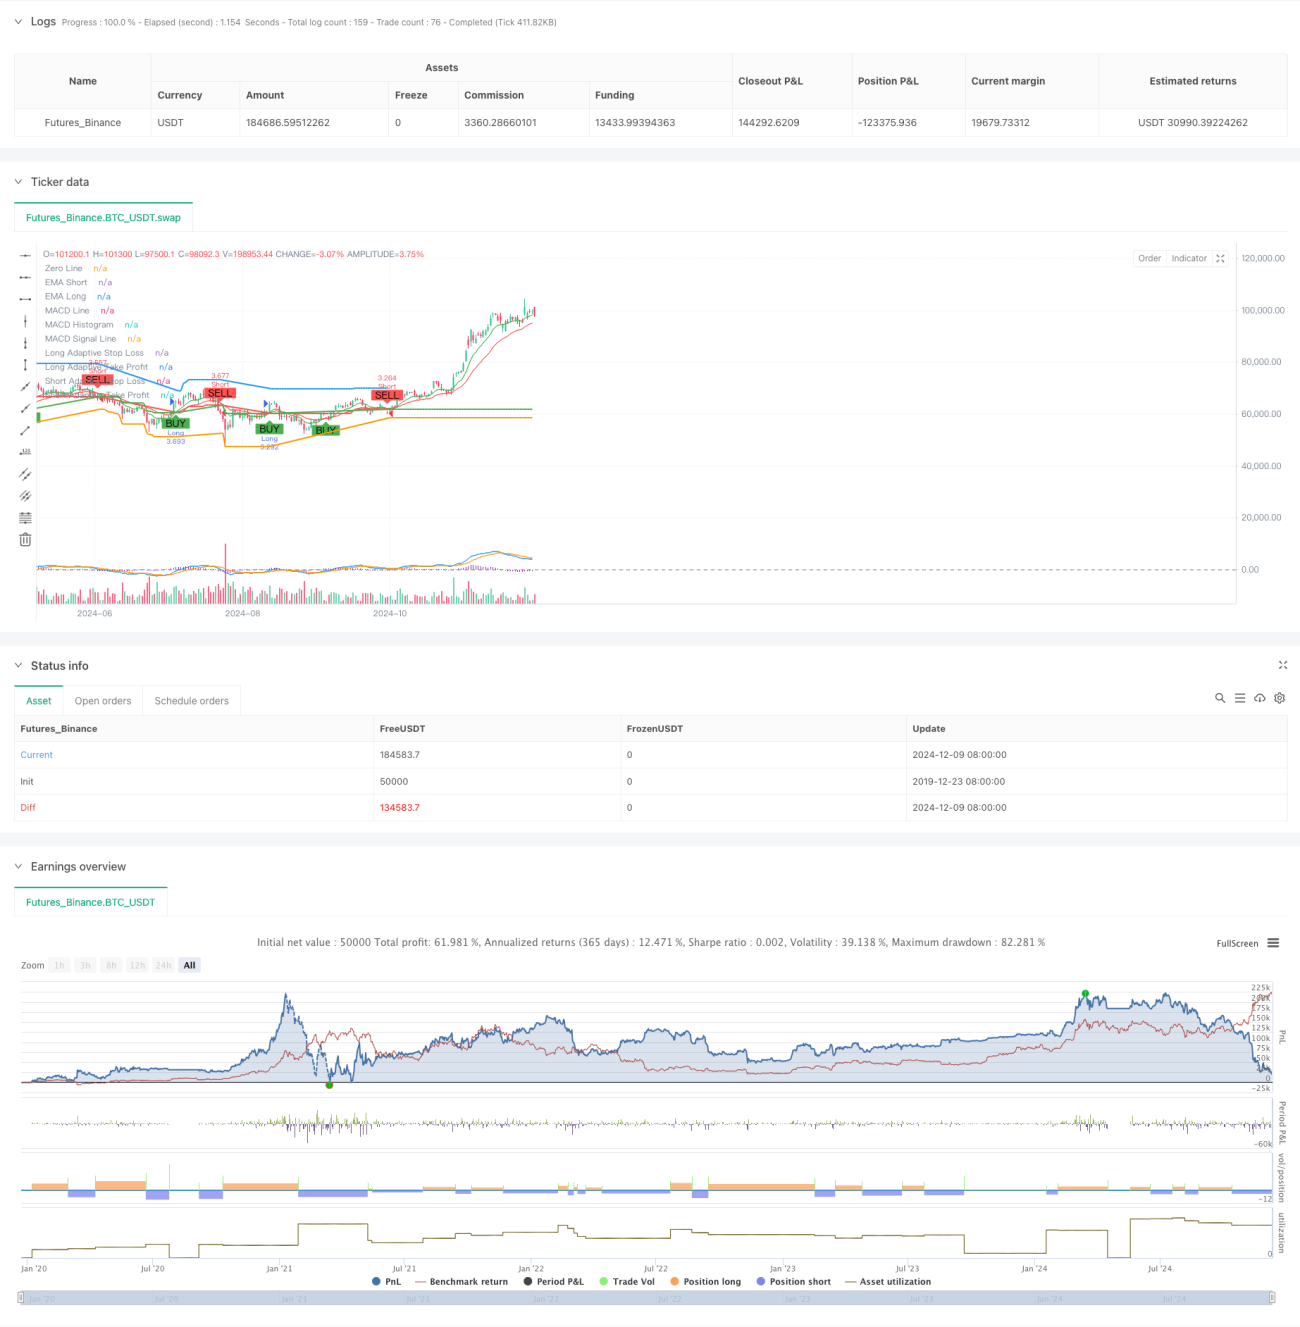
개요
이 전략은 여러 기술적 지표가 결합된 자기 적응 트렌드 추적 시스템이다. 이 전략의 핵심은 평행선 시스템을 사용하여 트렌드를 식별하고, RSI와 MACD를 통해 트렌드 강도를 확인하고, ATR에 기반한 위험 관리 매개 변수를 동적으로 조정하는 것이다.
전략 원칙
이 전략은 트리플 검증 메커니즘을 사용하여 거래합니다. 1) 트렌드 방향을 판단하기 위해 빠른 느린 기간의 EMA를 교차합니다. 2) RSI를 사용하여 매도 및 매도 수준을 확인하고 MACD 트렌드를 확인하여 거래 신호를 필터링합니다. 3) 더 높은 시간 주기 EMA를 도입하여 트렌드 확인합니다.
전략적 이점
- 다차원 신호 검증 메커니즘은 거래의 정확성을 크게 향상시킵니다.
- 적응형 상쇄장치 설정은 다양한 시장 환경에 더 잘 적응합니다.
- 더 높은 시간 주기의 트렌드 확인은 가짜 돌파의 위험을 효과적으로 감소시킵니다.
- 적절한 경고 시스템으로 거래 기회를 파악하고 위험을 통제할 수 있습니다.
- 유연한 거래 방향 설정으로 전략이 다른 거래 선호도에 맞게 조정됩니다.
전략적 위험
- 다중 인증 메커니즘으로 인해 몇 가지 빠른 기회를 놓칠 수 있습니다.
- 급격히 변동하는 시장에서 동적 상쇄가 너무 일찍 유발될 수 있습니다.
- 수평 정리 시장에서 빈번한 잘못된 신호가 발생할 수 있습니다.
- 매개 변수 최적화 과정에서 과도한 적합성의 위험이 존재할 수 있습니다.
- 다중 주기 분석은 다른 시간 주기에서 모순 신호를 나타낼 수 있다.
전략 최적화 방향
- 신호 신뢰성을 높이기 위해 보조 확인으로 트랜스포트 지표를 도입
- 트렌드 강도를 높여 입시 시기를 최적화하는 정량 평가 시스템
- 적응 가능한 변수 최적화 메커니즘을 개발하여 전략 안정성을 향상시킵니다.
- 시장 환경 분류 시스템에 가입하여 다른 시장에 대한 다른 매개 변수를 사용하십시오.
- 신호 강도에 따라 지분을 조정하는 동적 지점 관리 시스템을 개발
요약하다
이것은 엄격하게 설계된 트렌드 추적 시스템으로, 다단계 검증 메커니즘과 동적 위험 관리를 통해 포괄적인 거래 솔루션을 제공합니다. 전략의 핵심 장점은 자율성과 위험 제어 능력에 있습니다. 그러나 사용 시 변수 최적화 및 시장 환경의 일치 문제에 주의를 기울여야 합니다. 지속적인 최적화 및 개선으로, 이 전략은 다양한 시장 환경에서 안정적인 성능을 유지할 수 있습니다.
Source
Pine
/*backtest
start: 2019-12-23 08:00:00
end: 2024-12-10 08:00:00
period: 1d
basePeriod: 1d
exchanges: [{"eid":"Futures_Binance","currency":"BTC_USDT"}]
*/

//@version=5
strategy("TrenGuard Adaptive ATR Strategy", overlay=true, default_qty_type=strategy.percent_of_equity, default_qty_value=100)

// ParametersStrategy parameters
Related strategies
Comment
All comments (0)
No data
- 1