
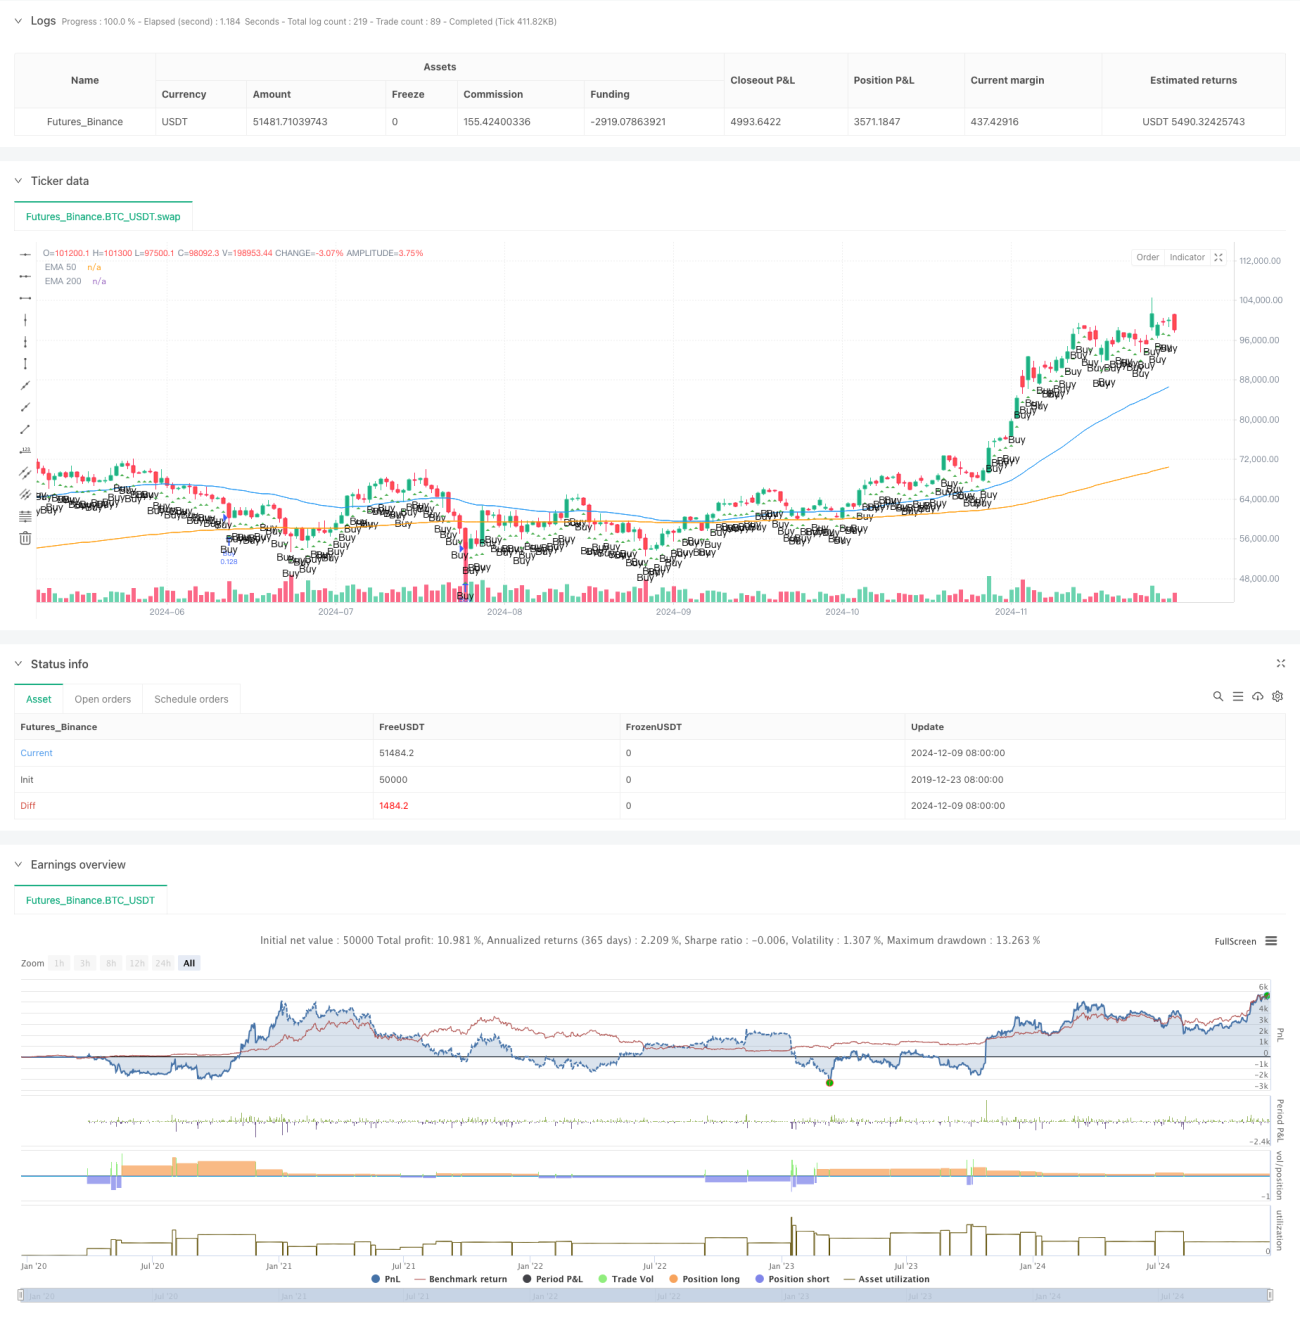
이것은 지지를 뚫는 것을 기반으로 한 동적 ATR 트렌드 추적 전략이다. 이 전략은 EMA 평균선 시스템, ATR 변동률 지표 및 스마트 펀드 개념 (SMC) 을 통합하여 시장 트렌드를 포착한다. 전략은 포지션 크기와 스톱 포지션을 동적으로 계산하여 좋은 위험 관리를 구현한다.
이 전략은 다음과 같은 몇 가지 핵심 구성 요소에 기반을 두고 있습니다.
이 전략은 합리적인 위험 관리와 여러 신호 확인을 통해 거래의 안정성을 향상시키는 보다 완전한 트렌드 추적 시스템이다. 약간의 뒤처짐이 있지만, 전체적으로 신뢰할 수있는 거래 시스템이다. 실제 사용 전에 충분한 피드백 검증을 수행하고 특정 거래 품종과 시장 환경에 따라 파라미터를 최적화하는 것이 좋습니다.
/*backtest
start: 2019-12-23 08:00:00
end: 2024-12-10 08:00:00
period: 1d
basePeriod: 1d
exchanges: [{"eid":"Futures_Binance","currency":"BTC_USDT"}]
*/
// TradingView Pine Script strategy for Smart Money Concept (SMC)
//@version=5
strategy("Smart Money Concept Strategy", overlay=true, default_qty_type=strategy.fixed, default_qty_value=100)
// === Input Parameters ===
input_risk_percentage = input.float(1, title="Risk Percentage", step=0.1)
input_atr_length = input.int(14, title="ATR Length")
input_ema_short = input.int(50, title="EMA Short")
input_ema_long = input.int(200, title="EMA Long")
// === Calculations ===
atr = ta.atr(input_atr_length)
ema_short = ta.ema(close, input_ema_short)
ema_long = ta.ema(close, input_ema_long)
// === Utility Functions ===
// Identify Order Blocks
is_order_block(price, direction) =>
((high[1] > high[2] and low[1] > low[2] and direction == 1) or (high[1] < high[2] and low[1] < low[2] and direction == -1))
// Identify Imbalance Zones
is_imbalance() =>
range_high = high[1]
range_low = low[1]
range_high > close and range_low < close
// Calculate Lot Size Based on Risk
calculate_lot_size(stop_loss_points, account_balance) =>
risk_amount = account_balance * (input_risk_percentage / 100)
lot_size = risk_amount / (stop_loss_points * syminfo.pointvalue)
lot_size
// Determine if Market is Consolidating
is_consolidating() =>
(ta.highest(high, 20) - ta.lowest(low, 20)) / atr < 2
// === Visual Enhancements ===
// Plot Order Blocks
// if is_order_block(close, 1)
// line.new(x1=bar_index[1], y1=low[1], x2=bar_index, y2=low[1], color=color.green, width=2, extend=extend.right)
// if is_order_block(close, -1)
// line.new(x1=bar_index[1], y1=high[1], x2=bar_index, y2=high[1], color=color.red, width=2, extend=extend.right)
// Highlight Imbalance Zones
// if is_imbalance()
// box.new(left=bar_index[1], top=high[1], right=bar_index, bottom=low[1], bgcolor=color.new(color.orange, 80))
// === Logic for Trend Confirmation ===
is_bullish_trend = ema_short > ema_long
is_bearish_trend = ema_short < ema_long
// === Entry Logic ===
account_balance = strategy.equity
if not is_consolidating()
if is_bullish_trend
stop_loss = close - atr * 2
take_profit = close + (math.abs(close - (close - atr * 2)) * 3)
stop_loss_points = math.abs(close - stop_loss) / syminfo.pointvalue
lot_size = calculate_lot_size(stop_loss_points, account_balance)
strategy.entry("Buy", strategy.long, qty=lot_size)
strategy.exit("TP/SL", "Buy", stop=stop_loss, limit=take_profit)
if is_bearish_trend
stop_loss = close + atr * 2
take_profit = close - (math.abs(close - (close + atr * 2)) * 3)
stop_loss_points = math.abs(close - stop_loss) / syminfo.pointvalue
lot_size = calculate_lot_size(stop_loss_points, account_balance)
strategy.entry("Sell", strategy.short, qty=lot_size)
strategy.exit("TP/SL", "Sell", stop=stop_loss, limit=take_profit)
// === Plotting Indicators ===
plot(ema_short, color=color.blue, title="EMA 50")
plot(ema_long, color=color.orange, title="EMA 200")
plotshape(series=is_bullish_trend and not is_consolidating(), style=shape.triangleup, location=location.belowbar, color=color.green, text="Buy")
plotshape(series=is_bearish_trend and not is_consolidating(), style=shape.triangledown, location=location.abovebar, color=color.red, text="Sell")