
1
Follow
1781
Followers
개요
이 전략은 상대적으로 약한 지표 ((RSI), 이동 평균 동향 분산 지표 ((MACD), 브린 밴드 ((BB) 및 거래량 ((Volume) 분석을 결합한 통합 거래 시스템입니다. 전략은 다차원 기술 지표의 조화를 통해 시장 추세, 변동성 및 거래량 등에 대한 전체적인 분석을 수행하여 최고의 거래 기회를 찾습니다.
전략 원칙
전략의 핵심 논리는 다음과 같은 측면에 기초합니다.
- RSI ((14) 를 사용하여 시장의 과매매 상태를 판단합니다. RSI가 30보다 낮으면 과매매로 간주됩니다.
- MACD ((12,26,9) 를 사용하여 트렌드 방향을 판단하고, MACD 금포는 다중 신호로 사용됩니다.
- 거래량 상승과 거래량 감소의 차이를 계산하여 가격 움직임을 확인하는 방법 (Delta Volume)
- 부린과 결합하여 시장 진입 시기를 최적화하기 위한 가격 변동성을 평가합니다.
- RSI 오버셀, MACD 골드포크, 델타 볼륨이 양성일 경우, 시스템은 최적의 구매 신호를 발산합니다.
- MACD 사각지대 또는 RSI가 60을 초과할 때, 시스템은 자동으로 위험을 통제하기 위해 청산합니다.
전략적 이점
- 다중 지표 크로스 검증은 거래 신호의 신뢰성을 높인다.
- 거래량 분석을 통해 가격 트렌드의 유효성을 확인합니다.
- 전략의 유연성을 강화하는 적응형 이동 평균 유형 선택
- 정지 및 정지 설정을 포함한 완벽한 위험 제어 장치
- 전략 매개 변수는 시장 상황에 따라 최적화 조정할 수 있습니다.
전략적 위험
- 다중 지표 조합은 신호 지연을 유발할 수 있습니다.
- 위축 시장에서 잘못된 신호가 발생할 수 있습니다.
- 과도한 매개변수 최적화는 과적합으로 이어질 수 있습니다.
- 높은 주파수 거래는 높은 거래 비용을 초래할 수 있습니다.
- 시장의 급격한 변동으로 인해 더 큰 회수일 수 있다.
전략 최적화 방향
- 시장 상태에 따라 동적으로 지수 변수를 조정하는 적응 변수 메커니즘을 도입합니다.
- 트렌드 강도 필터를 늘리고, 가로 시장의 가짜 신호를 줄여라
- 손해 방지 제도를 최적화하고 자금 사용 효율을 높여라
- 변동율 필터링 메커니즘에 가입하여 높은 변동율 환경에서 포지션을 조정합니다.
- 지능형 자금 관리 시스템 개발, 동적 포지션 제어
요약하다
이 전략은 RSI, MACD, 거래량과 같은 다차원 분석을 통해 시장 기회를 포착하는 여러 기술적 지표를 결합 한 복합적인 거래 전략입니다. 전략은 강력한 적응력과 확장성을 갖추고 있으며, 또한 완벽한 위험 제어 장치가 있습니다. 지속적인 최적화와 개선으로, 이 전략은 다양한 시장 환경에서 안정적인 성능을 유지할 것으로 예상됩니다.
Source
Pine
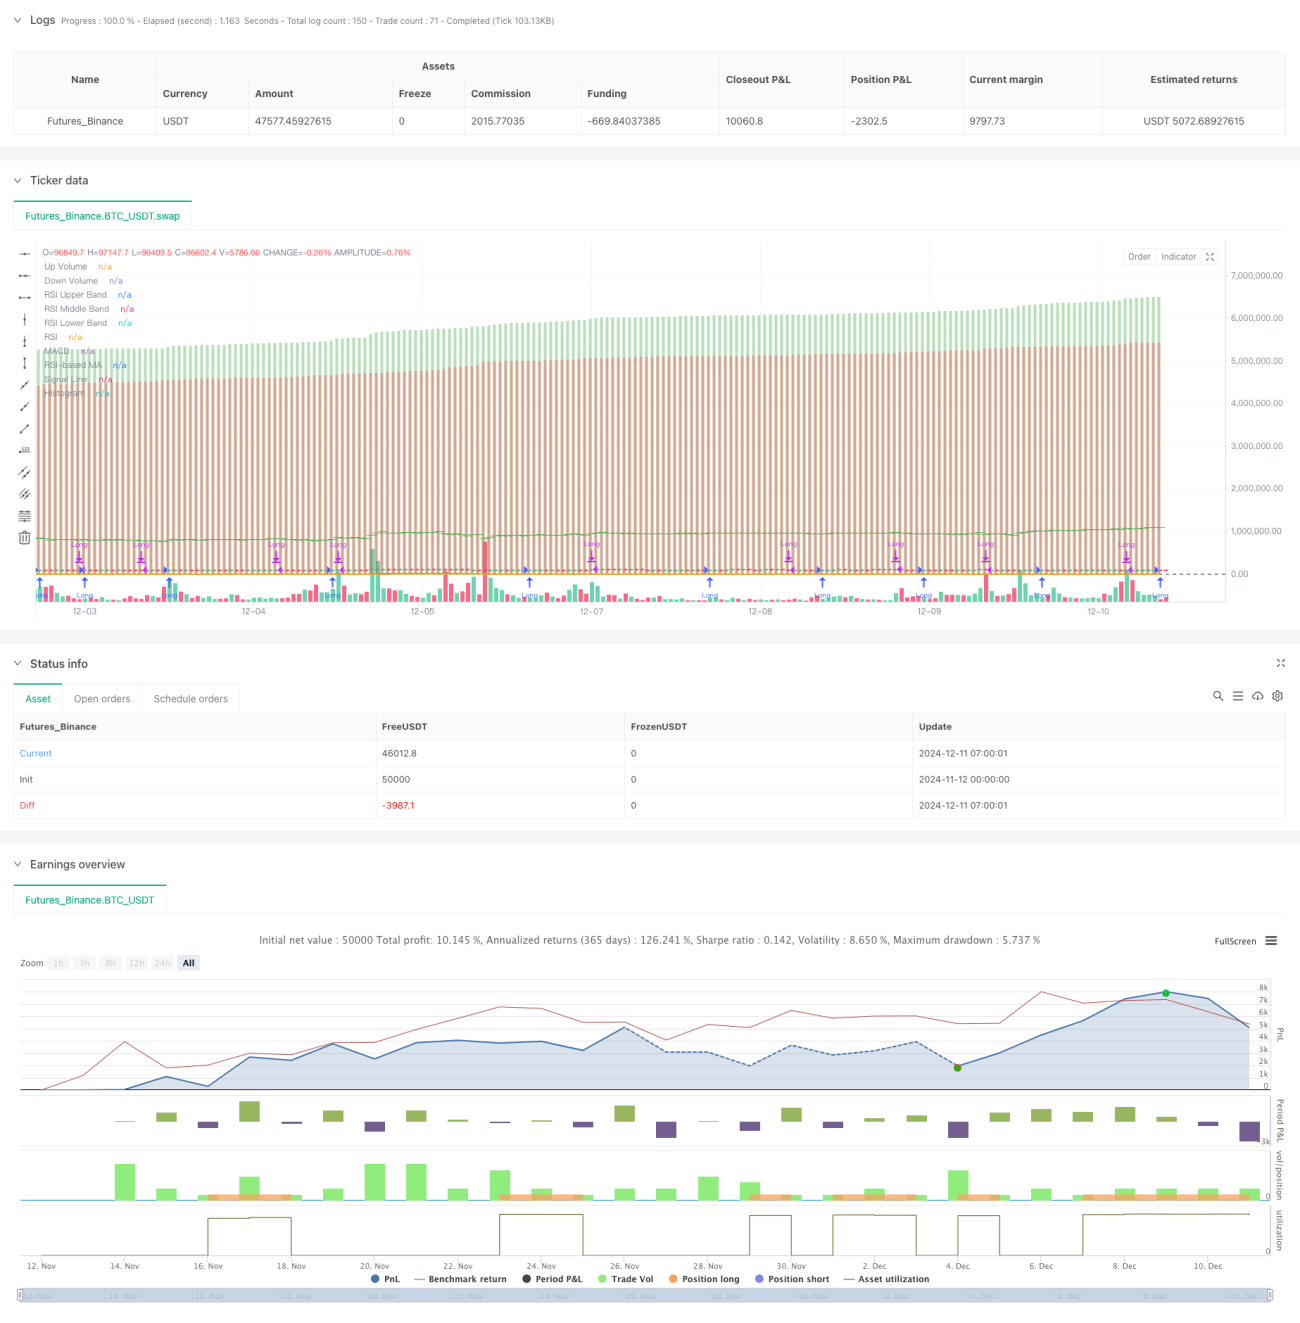
/*backtest
start: 2024-11-12 00:00:00
end: 2024-12-11 08:00:00
period: 1h
basePeriod: 1h
exchanges: [{"eid":"Futures_Binance","currency":"BTC_USDT"}]
*/

//@version=5
strategy("Liraz sh Strategy - RSI MACD Strategy with Bullish Engulfing and Net Volume", overlay=true, currency=currency.NONE, initial_capital=100000, commission_type=strategy.commission.percent, commission_value=0.1, slippage=3)

// Input parametersStrategy parameters
Related strategies
Comment
All comments (0)
No data
- 1