ATR 추세 추종 반전 전략과 결합된 동적 변동성 지표(VIDYA)

1
Follow
1780
Followers
개요
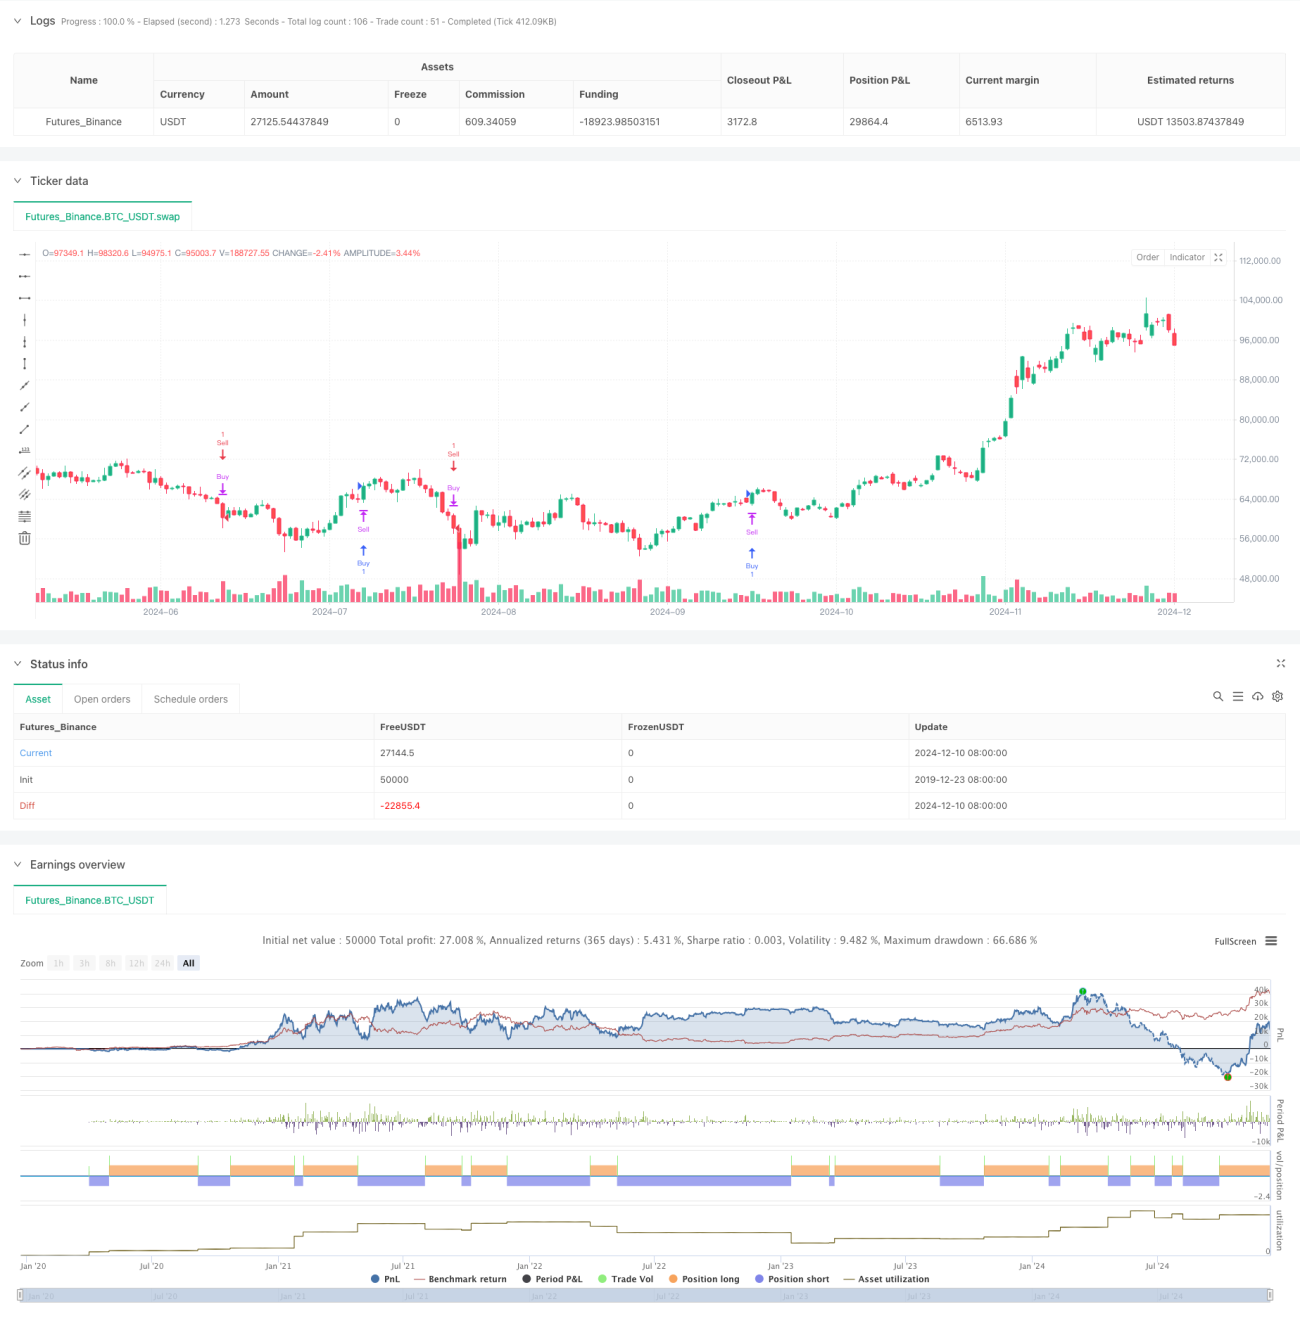
이 전략은 동적 변동률 지표 (VIDYA) 를 기반으로 한 트렌드 추적 거래 시스템으로, ATR 변동이 트렌드 식별 및 위험 관리 능력을 강화합니다. 이 전략은 동적으로 시장 변동에 대한 반응 속도를 조정하여 트렌드 추적 능력을 유지하면서 시장 역전 신호를 적시에 포착 할 수 있습니다.
전략 원칙
전략의 핵심은 VIDYA 지표의 동적 특성을 사용하여 트렌드를 식별하는 것입니다. VIDYA는 동력의 변화를 계산하여 이동 평균의 무게를 동적으로 조정하여 다른 시장 환경에서 다른 민감성을 갖습니다. 구체적으로:
- Chande 운동 진동기 (CMO) 를 사용하여 가격 동력을 계산합니다.
- 동력을 기반으로 계산하는 적응 인자 alpha
- ATR과 결합하여 동적 변동대를 구성
- 가격 돌파는 상행기를 생성하는 다중 신호, 하행기를 돌파하는 공백 신호
- 포지션 역전 논리를 사용함, 즉 새로운 신호는 동시에 오래된 포지션을 없애고 새로운 포지션을 열기
전략적 이점
- 동적 적응력: VIDYA 지표는 시장의 변동에 따라 변수를 자동으로 조정하여 전통적인 이동 평균의 지연 문제를 피할 수 있습니다.
- 리스크 제어: ATR의 동적 변동으로 인해 다양한 시장 환경에 적응할 수 있는 스톱로스 설정
- 신호 명확성: 트렌드 반전 논리를 적용하여 거래 신호가 명확하고 실행하기 쉽습니다.
- 시각화 효과: 상승과 하락의 흐름을 색상으로 구분하여 시장 상태를 직관적으로 표시합니다.
- 매개 변수 조정성: 핵심 매개 변수는 시장 특성에 따라 최적화 될 수 있습니다.
전략적 위험
- 변동 시장 위험: 변동 시장은 잘못된 신호를 발생시킬 수 있으며, 이는 거래의 빈도를 높일 수 있습니다.
- 슬라이포인트 영향: 반전 전략으로 인해, 모든 신호는 양방향 거래가 포함되며, 슬라이포인트 영향에 취약하다.
- 재원 관리 위험: 고정 비율 포지션 관리는 급격한 변동이 있을 때 큰 손실을 초래할 수 있습니다.
- 변수 민감성: VIDYA와 ATR의 변수 설정이 정책 성능에 큰 영향을 미칩니다.
- 시장 환경 의존성: 트렌드가 뚜렷한 시장에서 우수한 성과를 보지만 다른 시장 환경에서는 좋지 않을 수 있습니다.
전략 최적화 방향
- 트렌드 필터를 추가합니다: 장기 동향 판단을 추가하여 흔들리는 시장의 신호를 필터링 할 수 있습니다.
- 포지션 관리를 최적화: 시장의 변동에 따라 포지션 비율을 조정하는 동적 포지션 관리를 도입하는 것을 고려하십시오.
- 진입장 논리 변경: 신호 신뢰성을 높이기 위해 다른 기술 지표의 확인을 추가할 수 있다.
- 손해 방지 장치를 개선하십시오: 이동성 손해 또는 변동성에 기반한 동적 손해 방지 기능을 추가하는 것을 고려하십시오.
- 시간 필터를 추가: 다른 기간의 시장 특성에 따라 전략 매개 변수를 조정할 수 있습니다.
요약하다
이 전략은 VIDYA와 ATR을 결합하여 시장 추세에 대한 동적 추적과 위험을 제어합니다. 그것의 핵심 장점은 시장의 변동에 적응할 수 있다는 것입니다. 동향 추적 능력을 유지하면서도 반전 기회를 적시에 잡을 수 있습니다.
Source
Pine
Strategy parameters
Related strategies
Comment
All comments (0)
No data
- 1