다중 평형 가격 추세 추종 및 역전 거래 전략

1
Follow
1781
Followers
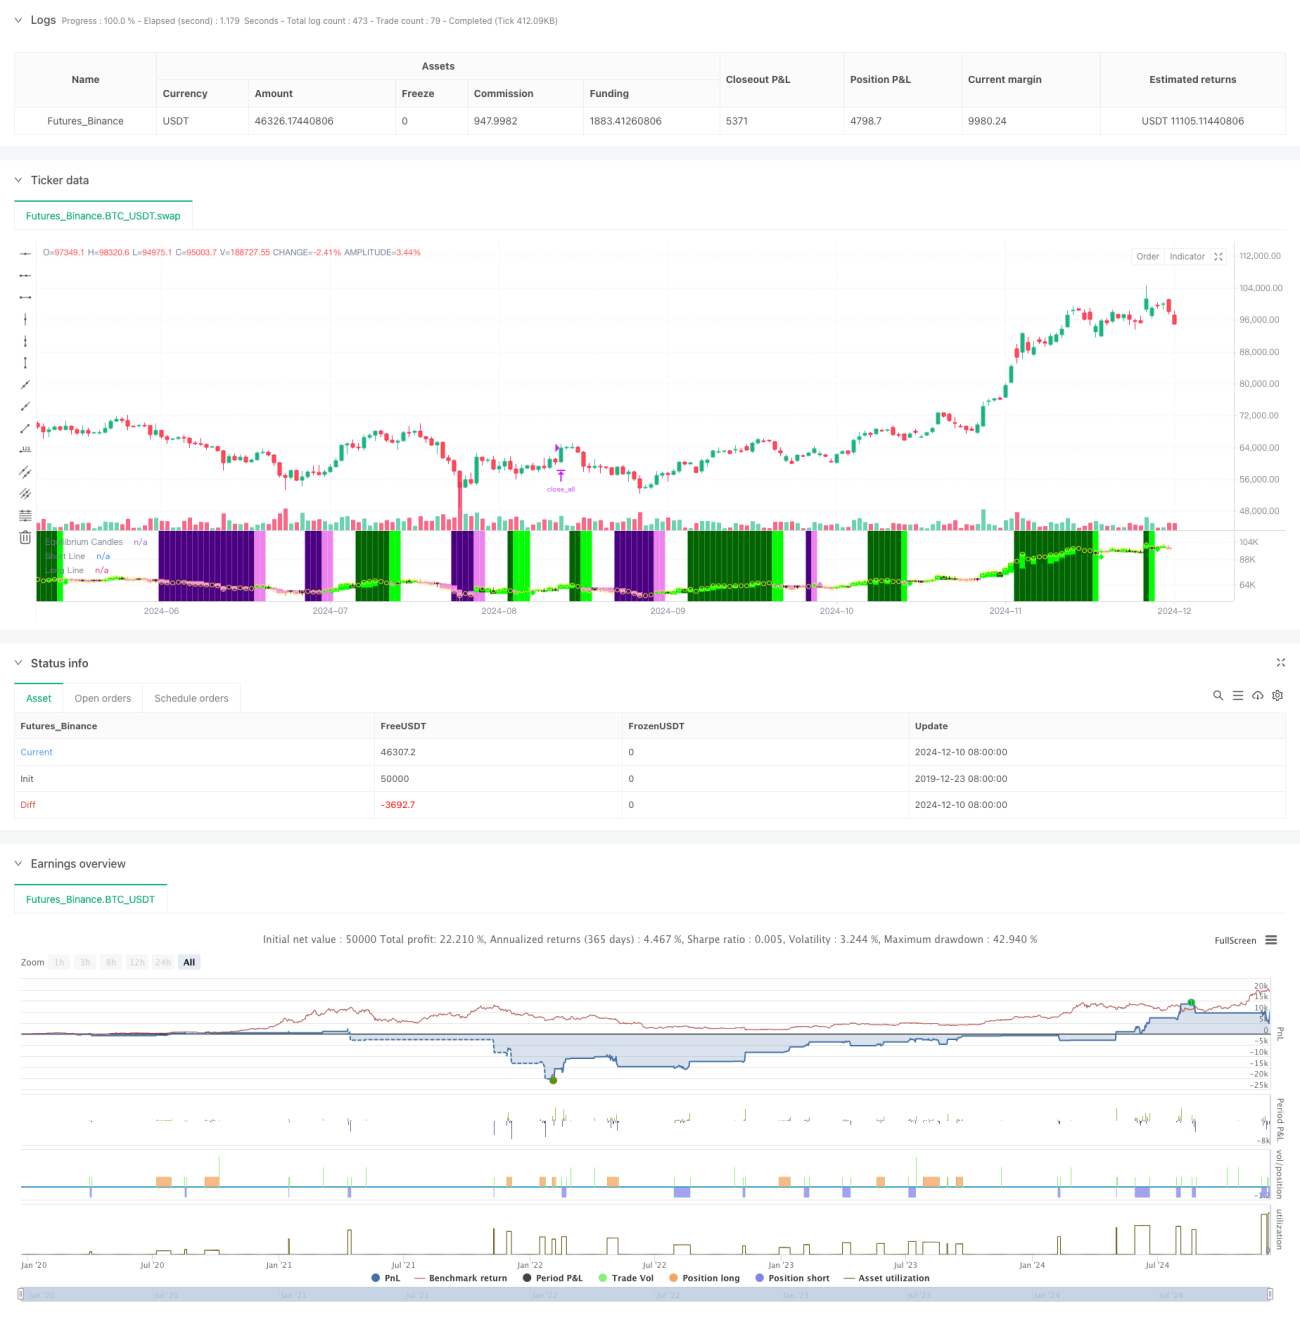
전략 개요
이 전략은 가격 평형점에 기반한 트렌드 추적 및 반전 거래 시스템이다. 그것은 지난 X 루트 K 선의 최고점과 최저점의 중간값을 계산하여 평형 가격을 결정하고, 평형 가격에 대한 종식 가격의 위치에 따라 트렌드 방향을 판단한다. 가격이 평형 가격의 한쪽에 연속적으로 유지되어 설정된 K 선의 수에 도달하면 시스템이 트렌드를 인정한다.
전략 원칙
- 평형 가격 계산: 과거 X 근 K 선의 최고 가격과 최저 가격의 중간 지점을 평형 가격으로 사용한다. 이것은 1차 평형 도표의 기준 선 계산 방법과 동일하다.
- 트렌드 판단: 가격이 평형 가격의 같은 편에서 연속적으로 X 루트 K 라인을 유지하면 트렌드가 성립한다.
- 입시 신호: 트렌드가 확립된 후 첫 번째 회전 (가격이 균형 가격을 뚫는 경우) 에서 입시 신호를 유발한다.
- 손해정지: ATR의 60% 점수를 사용하여 손해정지 거리를 동적으로 조정하여 위험 관리의 유연성을 제공합니다.
- 큰 변동성 보호: 가격의 평형점 오차가 설정된 ATR 배수를 초과할 때, 시스템은 급격한 철수를 방지하기 위해 자동으로 포지션을 청산한다.
전략적 이점
- 적응력: 시장 특성에 따라 유연하게 트렌드를 추적하고 거래 모드를 역전할 수 있다.
- 위험 제어: 동적 ATR 상실을 적용하고, 큰 변동 보호 장치가 있다.
- 명확한 운영: 거래 신호가 명확하고 복잡한 기술 지표 조합에 의존하지 않습니다.
- 시각화 효과는 좋습니다: 컬러 K선과 배경을 사용하여 시장 상태를 직관적으로 보여줍니다.
- 자동화 친화적: MT5와 같은 거래 플랫폼을 편리하게 연결하여 자동화 거래를 수행할 수 있습니다.
전략적 위험
- 위축 시장 위험: 위축 시장에서 빈번한 잘못된 신호가 발생할 수 있습니다.
- 슬라이드 효과: 급격한 변동이 있을 때 더 큰 슬라이드 문제가 발생할 수 있다.
- 변수 민감성: 균형 기간, 트렌드 판단 주기 등 핵심 변수들은 시장에 따라 신중하게 최적화되어야 한다.
- 시장 전환 위험: 시장이 추세에서 흔들림으로 전환하는 시기는 큰 회전을 초래할 수 있다.
전략 최적화 방향
- 시장 환경 인식: 시장 환경 판단 모듈을 추가하여 다양한 시장 조건에 따라 전략 매개 변수를 동적으로 조정합니다.
- 신호 필터링: 트래픽, 변동률과 같은 보조 지표를 추가하는 것을 고려하여 가짜 신호를 필터링하십시오.
- 포지션 관리: 더 복잡한 포지션 관리 메커니즘을 도입, 예를 들어 변동률에 기반한 동적 조정.
- 다중 시간 주기: 거래의 정확성을 높이기 위해 여러 시간 주기의 신호를 통합한다.
- 거래 비용 최적화: 다양한 거래 품종에 대한 비용 특성을 최적화하기 위한 시점.
요약하다
이것은 합리적으로 설계된 트렌드 거래 시스템이며, 균형 가격이라는 핵심 개념을 통해 명확한 거래 논리를 제공합니다. 이 전략의 가장 큰 특징은 유연성이 강하며, 트렌드 추적과 역전 거래 모두 사용할 수 있으며, 완벽한 위험 제어 장치를 갖추고 있습니다. 일부 시장 조건에서 도전을 받을 수 있지만, 지속적인 최적화와 유연한 조정으로, 이 전략은 다양한 시장 환경에서 안정적인 성능을 유지할 것으로 예상됩니다.
Source
Pine
Strategy parameters
Related strategies
Comment
All comments (0)
No data
- 1