월별 이동 평균 필터와 역사적 최고치 돌파를 결합한 추세 추종 양적 거래 전략

1
Follow
1781
Followers
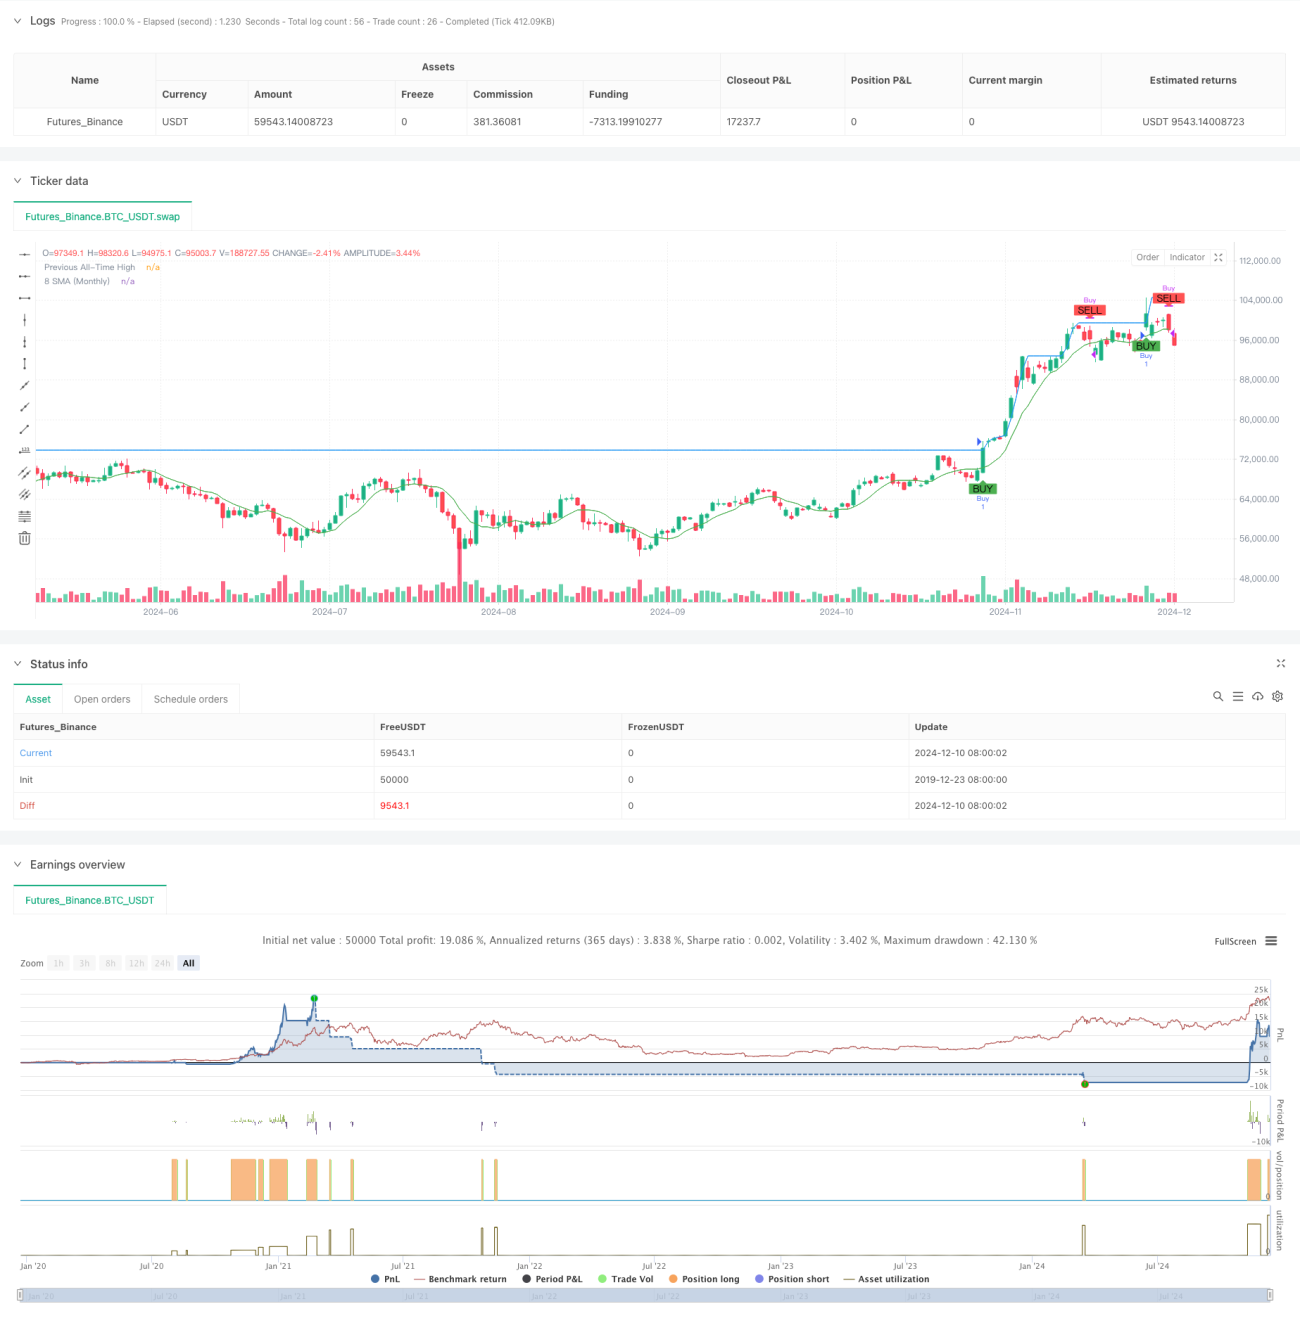
개요
이 전략은 역사적 신고위 돌파와 월선 평균선 필터링을 기반으로 한 트렌드 추적 전략이다. 그것은 가격이 돌파되었는지의 이전 역사적 최고점을 모니터링하여 구매 신호를 찾고, 월선 8주기 간단한 이동 평균 ((8 SMA) 을 판매 필터링 조건으로 사용하여 가짜 돌파의 위험을 줄인다. 이 전략 설계 철학은 "트렌드 연속성"이라는 시장 특성에 부합하며, 특히 강력한 상승 추세에서 큰 수준의 움직임을 포착하는 데 적합하다.
전략 원칙
이 전략의 핵심 논리는 두 가지 핵심 부분으로 이루어져 있습니다.
- 구매 신호: 최신 종식 가격이 전기 최고치를 돌파했을 때 (현재의 K 선의 최고 가격을 포함하지 않는 경우) 시스템은 구매 신호를 생성한다. 이 조건은 명확한 상승 추세에서만 입장을 보장한다.
- 팔기 신호: 월계 종점 가격이 8주기 간단한 이동 평균 아래로 떨어졌을 때, 시스템은 팔기 신호를 트리거한다. 이 조건은 적시에 손실을 멈추고, 트렌드 반전이 더 큰 손실을 초래하지 않도록 돕는다.
전략은 또한 신호 상태를 추적하는 메커니즘을 설계하여 동일한 상태에서 반복적으로 신호를 생성하는 것을 방지하여 전략의 안정성을 향상시킵니다.
전략적 이점
- 트렌드 포착 능력: 역대 최고를 돌파하는 판단을 통해 강력한 상승 추세를 효과적으로 포착할 수 있다.
- 위험 제어: 달선 평행선을 필터링 조건으로 결합하여 가짜 돌파구를 효과적으로 필터링 할 수 있습니다.
- 신호 안정성: lastSignal 변수를 통해 신호 상태를 추적하여 반복 신호 발생을 방지한다.
- 시각화 효과: 전략은 명확한 그래픽 인터페이스를 제공하며, 역사적인 최고점선, 평균선, 그리고 구매 신호 표시를 포함한다.
- 적응력: 전략은 다른 시간 주기 및 품종에 적용할 수 있다.
전략적 위험
- 지연성 위험: 사상 최고를 돌파하는 신호는 본질적으로 지연성이 있으며, 최고의 진입 시기를 놓칠 수 있다.
- 허위 돌파 위험: 월선 평선 필터링이 있음에도 불구하고, 흔들리는 시장에서 허위 돌파가 발생할 수 있다.
- 회수 위험: 트렌드 전환점에서는 전략이 큰 회수를 감수할 수 있다.
- 자금 관리 위험: 전략에는 포지션 관리 장치가 포함되어 있지 않으며 추가 자금 관리 규칙이 필요합니다.
전략 최적화 방향
- 도입량 확인 가능: 교역량 지표를 추가하여 신호 신뢰성을 높일 수 있다.
- 손해 차단 메커니즘을 개선합니다. 더 유연한 손해 차단 규칙을 설계할 수 있습니다.
- 추가 포지션 관리: 시장의 변동률과 트렌드 강도에 따라 포지션 크기를 동적으로 조정한다.
- 최적화 신호 필터링: ADX와 같은 트렌드 강도 지표를 추가하여 약점 신호를 더 필터링 할 수 있습니다.
- 시간 필터 추가: 시간 주기를 필터링하여 부적절한 시간에 거래하는 것을 방지할 수 있습니다.
요약하다
이것은 합리적이고 논리적으로 명확하게 설계된 트렌드 추적 전략이다. 역사적으로 새로운 고위 돌파구와 달의 평균선을 조합하여 트렌드를 효과적으로 파악하는 것은 물론, 위험을 합리적으로 통제하는 것도 보장한다. 약간의 뒤처짐과 가짜 돌파구 위험이 있지만, 제안된 최적화 방향을 통해 전략의 전체적인 성능이 더욱 향상될 전망이다. 이 전략은 명확한 트렌드가있는 시장 환경에서 특히 적합하며, 중장기 투자에 중요한 참조 도구로 사용될 수 있다.
Source
Pine
Related strategies
Comment
All comments (0)
No data
- 1