MACD-RSI 트렌드 모멘텀 크로스오버 전략과 위험 관리 모델을 결합

1
Follow
1781
Followers
개요
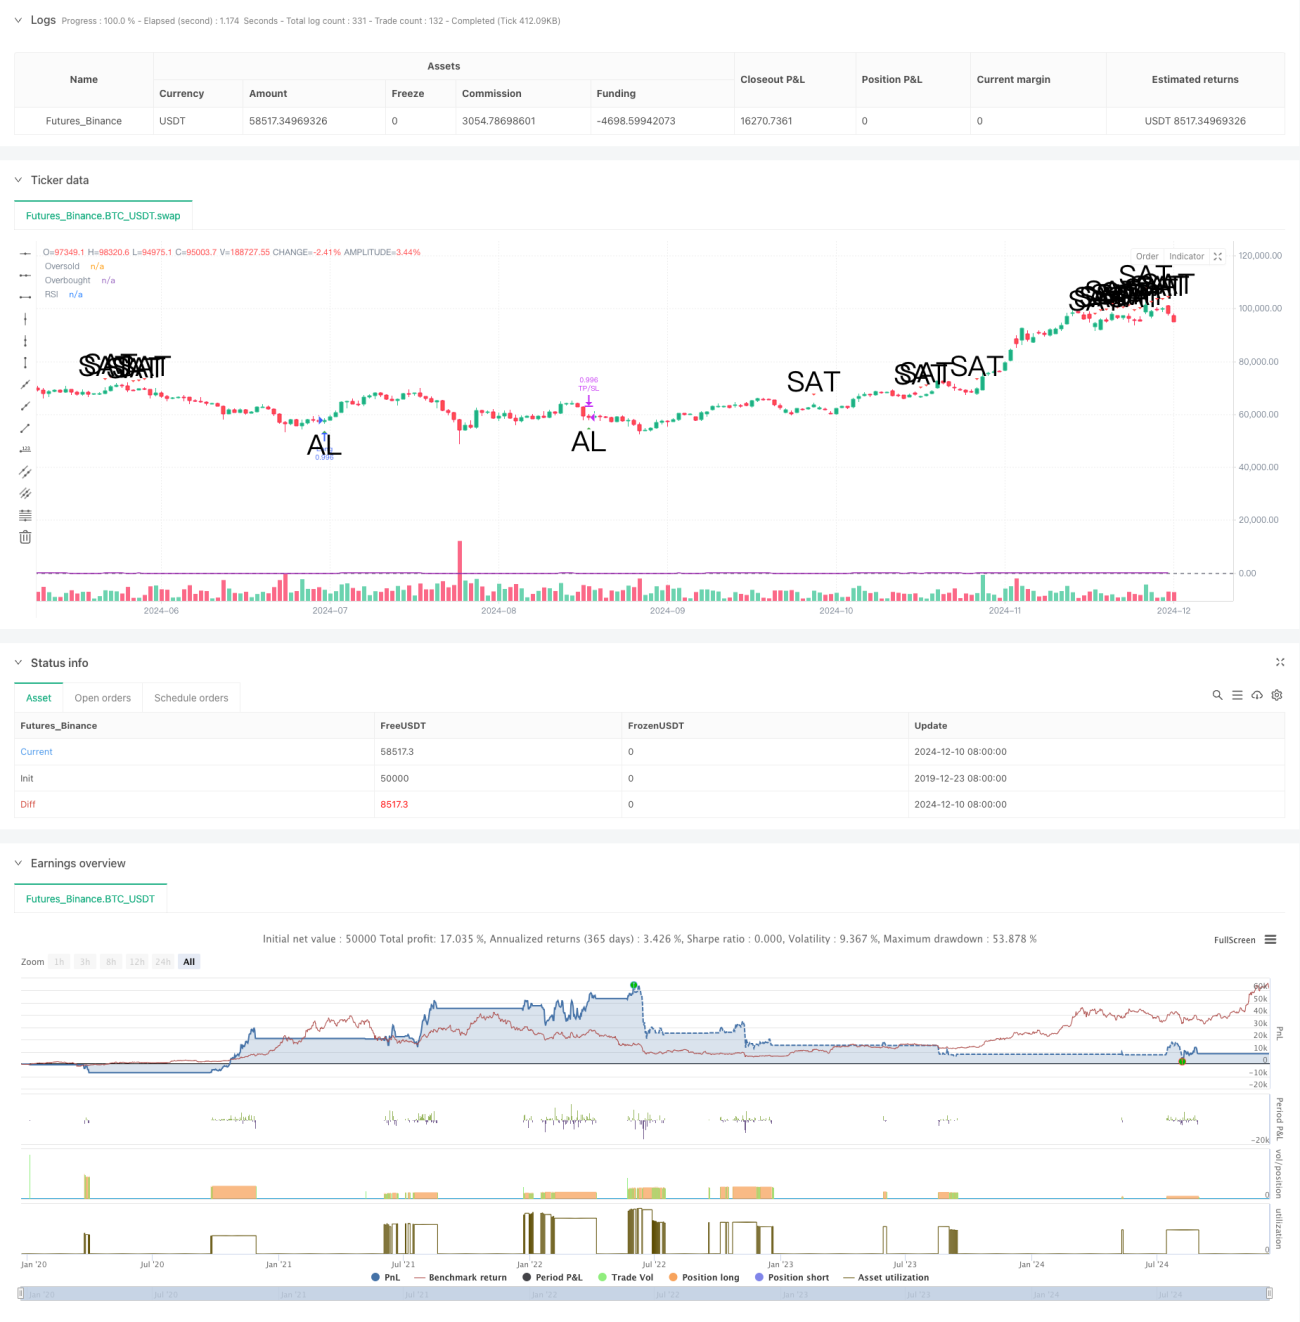
이 전략은 MACD (이동 평균의 종결 분산) 과 RSI (대비적으로 강한 지표) 를 결합한 트렌드 추적 거래 시스템이다. 이 전략은 5 분 시간 주기에서 실행되며, MACD와 신호 라인의 교차와 RSI가 초과 구매 초과 판매 수준을 분석하여 거래 신호를 생성한다. 또한 위험 관리를 구현하기 위해 퍼센트 기반의 손실 및 수익 결제 장치를 통합한다.
전략 원칙
이 전략은 다음과 같은 핵심 논리에 기반을 두고 있습니다.
- 12-26-9 변수 설정으로 MACD 지표가 가격 추세를 포착합니다.
- 14주기 RSI 지표가 과매매 현상을 식별합니다.
- MACD 라인에서 신호선을 통과하고 RSI가 45보다 낮으면 다중 신호가 발생
- MACD 오프라인으로 신호선을 통과하고 RSI가 55보다 높을 때 평지 신호를 유발합니다.
- 리스크를 제어하기 위해 1.2%의 스톱로드를 설정하고, 수익을 고정하기 위해 2.4%의 스톱로드를 설정합니다.
- 10주기 EMA를 트렌드 필터로 사용하여 신호 품질을 향상시킵니다.
전략적 이점
- 지표 포트폴리오의 장점: MACD의 트렌드 추적 특성과 RSI의 변동 특성을 결합하여 시장의 전환점을 더 정확하게 포착할 수 있습니다.
- 리스크 제어: 고정 비율의 중지 손실을 방지하고, 단일 거래의 위험을 엄격하게 제어
- 신호 확인 메커니즘: MACD 및 RSI 조건을 동시에 충족해야 입장을 열 수 있으며, 가짜 신호를 줄일 수 있습니다.
- 적응력: 다양한 시장 환경에 따라 변수를 조정할 수 있습니다.
- 명확한 실행 논리: 거래 규칙이 명확하고 자동화하기 쉽습니다.
전략적 위험
- 변동 시장 위험: 수평 변동 시장에서 빈번한 거래로 인해 손실이 발생할 수 있습니다.
- 슬라이드 위험: 5 분 주기 거래가 자주 발생하여 큰 슬라이드 위험이 발생할 수 있습니다.
- 가짜 돌파 위험: MACD 교차 신호가 가짜 돌파를 일으킬 수 있다
- 매개 변수 민감성: 지표 매개 변수 설정이 전략 성능에 큰 영향을 미칩니다.
- 시장 환경 의존성: 전략이 트렌드 명확한 시장에서 더 잘 작동합니다.
전략 최적화 방향
- 트랜지스 양 필터를 추가: 신호 생성 시 트랜지스 양 요소를 고려하여 신호 신뢰성을 향상
- 동적 중지 손실 설정: 시장의 변동에 따라 자동으로 조정되는 중지 손실 비율
- 트렌드 강도 필터 도입: ADX와 같은 트렌드 강도 지표를 추가하여 거래 시기를 최적화
- 포지션 관리를 개선: 변동율 기반의 동적 포지션 제어
- 최적화 매개 변수 적응: 매개 변수 동적 최적화 메커니즘을 개발하고, 전략 적응성을 향상
요약하다
이 전략은 MACD와 RSI의 장점을 결합하여 트렌드 추적과 동적 특성을 겸비한 거래 시스템을 구축한다. 완벽한 위험 제어 장치와 명확한 거래 논리는 좋은 실용성을 갖는다. 제안된 최적화 방향을 통해 전략은 더 발전할 여지가 있다. 실내 적용 시 충분한 피드백 검증을 실시하고 특정 시장 특성에 따라 파라미터를 적절하게 조정하는 것이 좋습니다.
Source
Pine
/*backtest
start: 2019-12-23 08:00:00
end: 2024-12-11 08:00:00
period: 1d
basePeriod: 1d
exchanges: [{"eid":"Futures_Binance","currency":"BTC_USDT"}]
*/

// This source code is subject to the terms of the Mozilla Public License 2.0 at https://mozilla.org/MPL/2.0/
//@version=5
strategy("MACD + RSI Basit Strateji", overlay=true, initial_capital=1000, default_qty_type=strategy.percent_of_equity, default_qty_value=100)
Strategy parameters
Related strategies
Comment
All comments (0)
No data
- 1