듀얼 이동 평균과 MACD를 결합한 트렌드 추적 동적 이익 실현 지능형 거래 시스템

MA MACD SMA EMA TP SL PIPS
생성 날짜: 2024-12-13 11:23:00 마지막으로 수정됨: 2024-12-13 11:23:00
복사: 0 클릭수: 439
avatar of ChaoZhang ChaoZhang
1
집중하다
1621
수행원

듀얼 이동 평균과 MACD를 결합한 트렌드 추적 동적 이익 실현 지능형 거래 시스템

개요

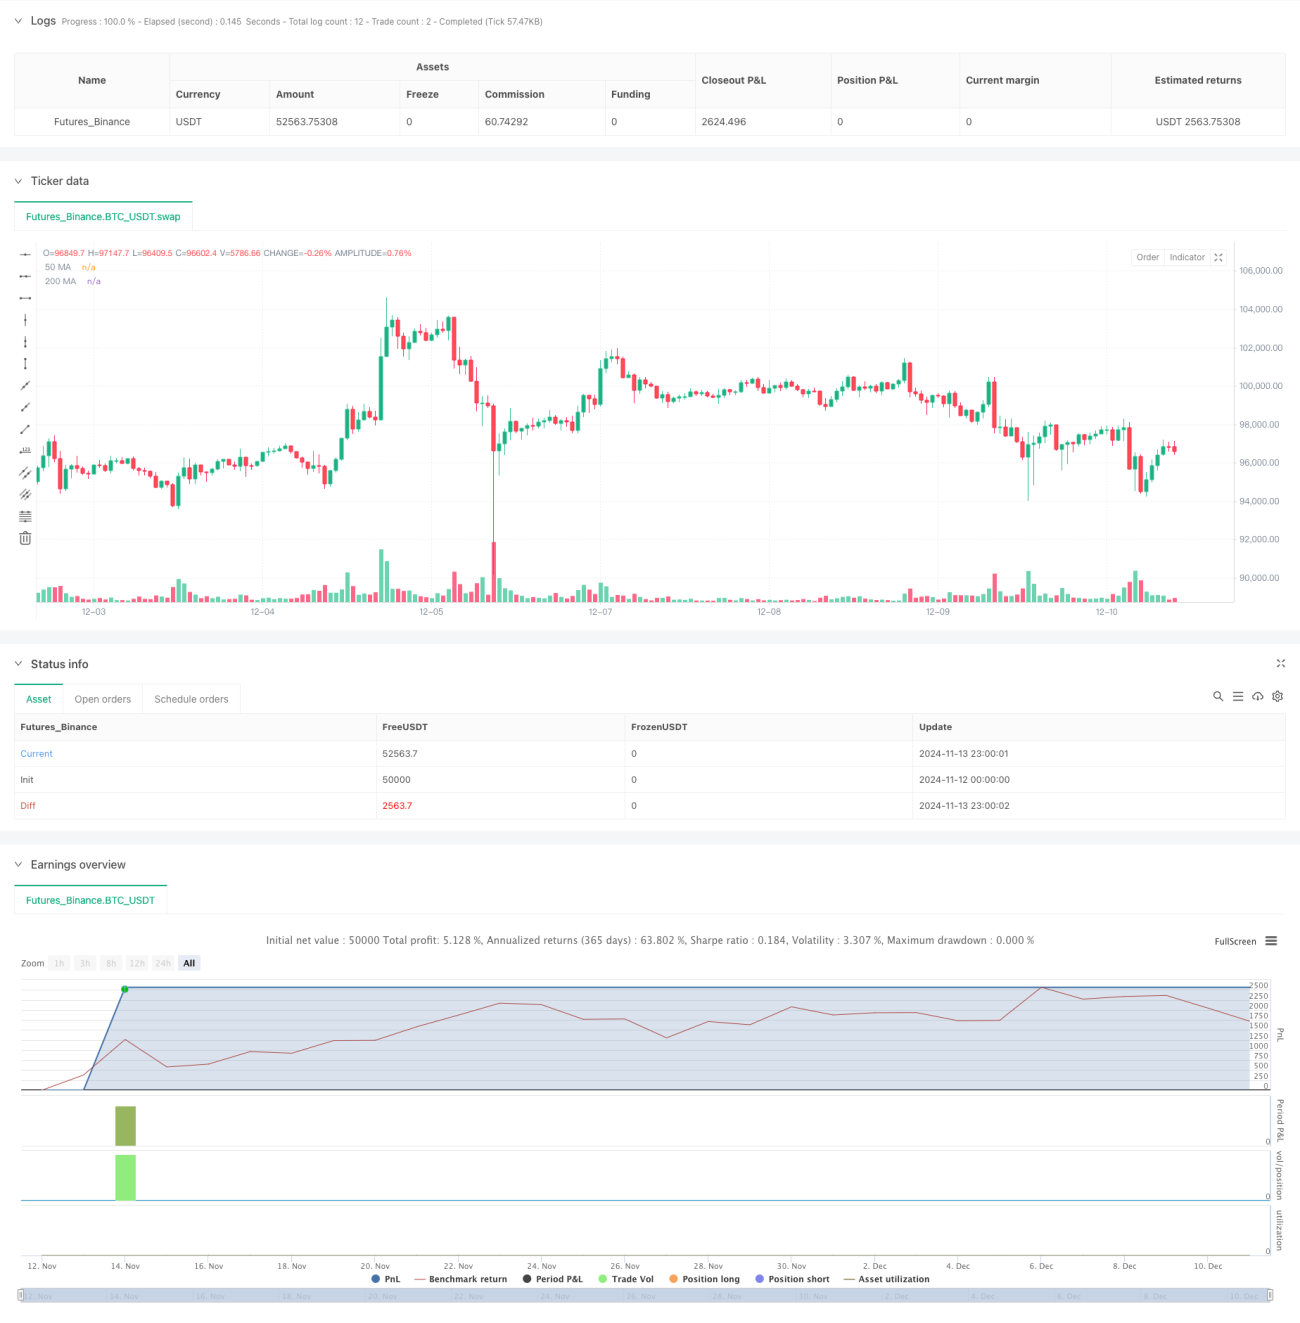
이 전략은 이중 이동 평균과 MACD 지표를 결합한 트렌드 추적 시스템이다. 그것은 50과 200기 이동 평균을 사용하여 트렌드 방향을 결정하고 MACD 지표를 사용하여 특정 진입 시점을 포착한다. 이 전략은 동적인 스톱 스톱 손실 메커니즘을 채택하고 여러 필터링 조건을 통해 거래 품질을 향상시킵니다.

전략 원칙

이 전략의 핵심 논리는 다음과 같은 몇 가지 핵심 요소에 기반합니다.

  1. 추세 판단: 50 평균선과 200 평균선의 위치 관계를 사용하여 전체 추세를 판단하고, 빠른 평균선이 느린 평균선 위에 있을 때 상승 추세로 판단하고, 반대로 하향 추세로 판단한다.
  2. 입구 신호: 트렌드 방향을 확인한 후 MACD 지표의 교차를 사용하여 특정 입구 신호를 유발한다. 상승 추세에서 MACD 라인 상의 신호 라인을 통과 할 때 입구가 더 많이 이루어집니다. 하향 추세에서 MACD 라인 아래의 신호 라인을 통과 할 때 입구가 공백합니다.
  3. 거래 필터: 최소 거래 간격, 트렌드 강도 및 MACD 마이너스 등의 여러 필터 메커니즘을 도입하여 격렬한 변동 시장 환경에서 과도한 거래를 방지합니다.
  4. 위험 제어: 고정 점수 상쇄 및 조정 가능한 정지 메커니즘을 사용하여 이동 평균선과 MACD의 역전 신호를 동적 퇴출 조건으로 결합합니다.

전략적 이점

  1. 트렌드 추적과 동력 결합: 이동 평균선과 MACD 지표를 결합하여 큰 트렌드를 파악하고 정확한 진입 시간을 결정할 수 있습니다.
  2. 리스크 관리가 잘 되어있으며, 고정된 리스크와 기술 지표에 의해 촉발된 다이내믹 리스크를 포함한 여러 가지 리스크 제도를 갖추고 있습니다.
  3. 유연한 파라미터 설정: 스톱로스 스톱 스 포인트 수, 평균주기 등과 같은 핵심 파라미터는 시장 상황에 따라 유연하게 조정할 수 있다.
  4. 스마트 필터링 메커니즘: 여러 필터링 조건을 통해 가짜 신호를 줄이고 거래 품질을 향상시킵니다.
  5. 완전한 성능 통계: 승률, 평균 수익, 손실과 같은 주요 지표의 실시간 계산을 포함한 자세한 거래 통계 기능을 내장합니다.

전략적 위험

  1. 흔들림 시장 위험: 가로판 흔들림 시장에서 빈번한 잘못된 신호가 발생할 수 있으므로, 추세 확인 지표를 추가하는 것이 좋습니다.
  2. 슬라이드 리스크: 소주기 거래는 슬라이드 영향을 받기 쉽다. 적절히 느슨한 중지 손실 설정을 권장한다.
  3. 매개 변수 민감성: 정책 성능은 매개 변수 설정에 민감하며, 충분한 매개 변수 최적화를 거쳐야 한다.
  4. 시장 환경 의존성: 전략은 강한 추세 시장에서 잘 작동하지만 다른 시장 환경에서는 효과가 불안정할 수 있다.

전략 최적화 방향

  1. 동적 중지 최적화: ATR 지표에 따라 동적으로 중지 폭을 조정하여 시장의 변동에 더 잘 적응 할 수 있습니다.
  2. 진입 시점 최적화: RSI와 같은 보조 지표를 추가하여 진입 시점을 확인하고 거래 정확도를 향상시킬 수 있다.
  3. 포지션 관리 최적화: 변동율에 기반한 동적 포지션 관리 시스템을 도입하여 위험을 더 잘 제어한다.
  4. 시장 환경 인식: 시장 환경 인식 모듈을 추가하여 다른 시장 조건에서 다른 파라미터 조합을 사용합니다.

요약하다

이것은 합리적이고 논리적으로 설계된 트렌드 추적 거래 시스템이다. 고전적인 기술 지표와 현대적인 위험 관리 방법을 결합하여, 이 전략은 트렌드를 파악하면서도 위험에 대한 통제에 초점을 맞추고 있다. 일부 최적화가 필요한 곳이 있기는 하지만, 전체적으로 실용적인 가치가있는 거래 전략이다. 거래자는 실전 사용 이전에 충분한 피드백을 수행하고, 특정 거래 상품과 시장 환경 파라미터에 따라 적절한 조정을 하도록 권장한다.

전략 소스 코드
/*backtest
start: 2024-11-12 00:00:00
end: 2024-12-11 08:00:00
period: 1h
basePeriod: 1h
exchanges: [{"eid":"Futures_Binance","currency":"BTC_USDT"}]
*/

// This Pine Script™ code is subject to the terms of the Mozilla Public License 2.0 at https://mozilla.org/MPL/2.0/
// © WolfofAlgo

//@version=5
strategy("Trend Following Scalping Strategy", overlay=true, initial_capital=10000, default_qty_type=strategy.percent_of_equity, default_qty_value=200)

// Input Parameters
stopLossPips = input.float(5.0, "Stop Loss in Pips", minval=1.0)
takeProfitPips = input.float(10.0, "Take Profit in Pips", minval=1.0)
useFixedTakeProfit = input.bool(true, "Use Fixed Take Profit")

// Moving Average Parameters
fastMA = input.int(50, "Fast MA Period")
slowMA = input.int(200, "Slow MA Period")

// MACD Parameters
macdFastLength = input.int(12, "MACD Fast Length")
macdSlowLength = input.int(26, "MACD Slow Length")
macdSignalLength = input.int(9, "MACD Signal Length")

// Trade Filter Parameters (Adjusted to be less strict)
minBarsBetweenTrades = input.int(5, "Minimum Bars Between Trades", minval=1)
trendStrengthPeriod = input.int(10, "Trend Strength Period")
minTrendStrength = input.float(0.4, "Minimum Trend Strength", minval=0.1, maxval=1.0)
macdThreshold = input.float(0.00005, "MACD Threshold", minval=0.0)

// Variables for trade management
var int barsLastTrade = 0
barsLastTrade := nz(barsLastTrade[1]) + 1

// Calculate Moving Averages
ma50 = ta.sma(close, fastMA)
ma200 = ta.sma(close, slowMA)

// Calculate MACD
[macdLine, signalLine, _] = ta.macd(close, macdFastLength, macdSlowLength, macdSignalLength)

// Calculate trend strength (simplified)
trendDirection = ta.ema(close, trendStrengthPeriod) > ta.ema(close, trendStrengthPeriod * 2)
isUptrend = close > ma50 and ma50 > ma200
isDowntrend = close < ma50 and ma50 < ma200

// Calculate pip value
pointsPerPip = syminfo.mintick * 10

// Entry Conditions with Less Strict Filters
macdCrossUp = ta.crossover(macdLine, signalLine) and math.abs(macdLine - signalLine) > macdThreshold
macdCrossDown = ta.crossunder(macdLine, signalLine) and math.abs(macdLine - signalLine) > macdThreshold

// Long and Short Conditions
longCondition = close > ma50 and macdCrossUp and barsLastTrade >= minBarsBetweenTrades and isUptrend
shortCondition = close < ma50 and macdCrossDown and barsLastTrade >= minBarsBetweenTrades and isDowntrend

// Exit Conditions (made more lenient)
exitLongCondition = macdCrossDown or close < ma50
exitShortCondition = macdCrossUp or close > ma50

// Reset bars counter on new trade
if (longCondition or shortCondition)
    barsLastTrade := 0

// Calculate stop loss and take profit levels
longStopPrice = strategy.position_avg_price - (stopLossPips * pointsPerPip)
longTakeProfitPrice = strategy.position_avg_price + (takeProfitPips * pointsPerPip)
shortStopPrice = strategy.position_avg_price + (stopLossPips * pointsPerPip)
shortTakeProfitPrice = strategy.position_avg_price - (takeProfitPips * pointsPerPip)

// Plot Moving Averages
plot(ma50, "50 MA", color=color.blue)
plot(ma200, "200 MA", color=color.red)

// Plot Entry Signals
plotshape(longCondition, "Long Signal", shape.triangleup, location.belowbar, color.green, size=size.small)
plotshape(shortCondition, "Short Signal", shape.triangledown, location.abovebar, color.red, size=size.small)

// Strategy Entry Rules
if (longCondition and strategy.position_size == 0)
    strategy.entry("Long", strategy.long)

if (shortCondition and strategy.position_size == 0)
    strategy.entry("Short", strategy.short)

// Strategy Exit Rules
if (strategy.position_size > 0 and exitLongCondition)
    strategy.close("Long")

if (strategy.position_size < 0 and exitShortCondition)
    strategy.close("Short")

// Stop Loss and Take Profit Management
if (strategy.position_size > 0)
    strategy.exit("Long TP/SL", "Long", stop=longStopPrice, limit=useFixedTakeProfit ? longTakeProfitPrice : na)

if (strategy.position_size < 0)
    strategy.exit("Short TP/SL", "Short", stop=shortStopPrice, limit=useFixedTakeProfit ? shortTakeProfitPrice : na)

// Performance Metrics
var float totalTrades = 0
var float winningTrades = 0
var float totalProfitPips = 0
var float totalLossPips = 0

if (strategy.closedtrades > 0)
    totalTrades := strategy.closedtrades
    winningTrades := strategy.wintrades
    totalProfitPips := strategy.grossprofit / pointsPerPip
    totalLossPips := math.abs(strategy.grossloss) / pointsPerPip

// Display Stats
var label statsLabel = na
label.delete(statsLabel[1])

// Create performance stats text
var string stats = ""
if (strategy.closedtrades > 0)
    winRate = (winningTrades / math.max(totalTrades, 1)) * 100
    avgWin = totalProfitPips / math.max(winningTrades, 1)
    avgLoss = totalLossPips / math.max(totalTrades - winningTrades, 1)
    plRatio = avgWin / math.max(avgLoss, 1)
    
    stats := "Win Rate: " + str.tostring(winRate, "#.##") + "%\n" +
             "Avg Win: " + str.tostring(avgWin, "#.##") + " pips\n" +
             "Avg Loss: " + str.tostring(avgLoss, "#.##") + " pips\n" +
             "P/L Ratio: " + str.tostring(plRatio, "#.##") + "\n" +
             "Total Trades: " + str.tostring(totalTrades, "#")

statsLabel := label.new(x=bar_index, y=high, text=stats, style=label.style_label_down, color=color.new(color.blue, 80))