
1
Follow
1781
Followers
개요
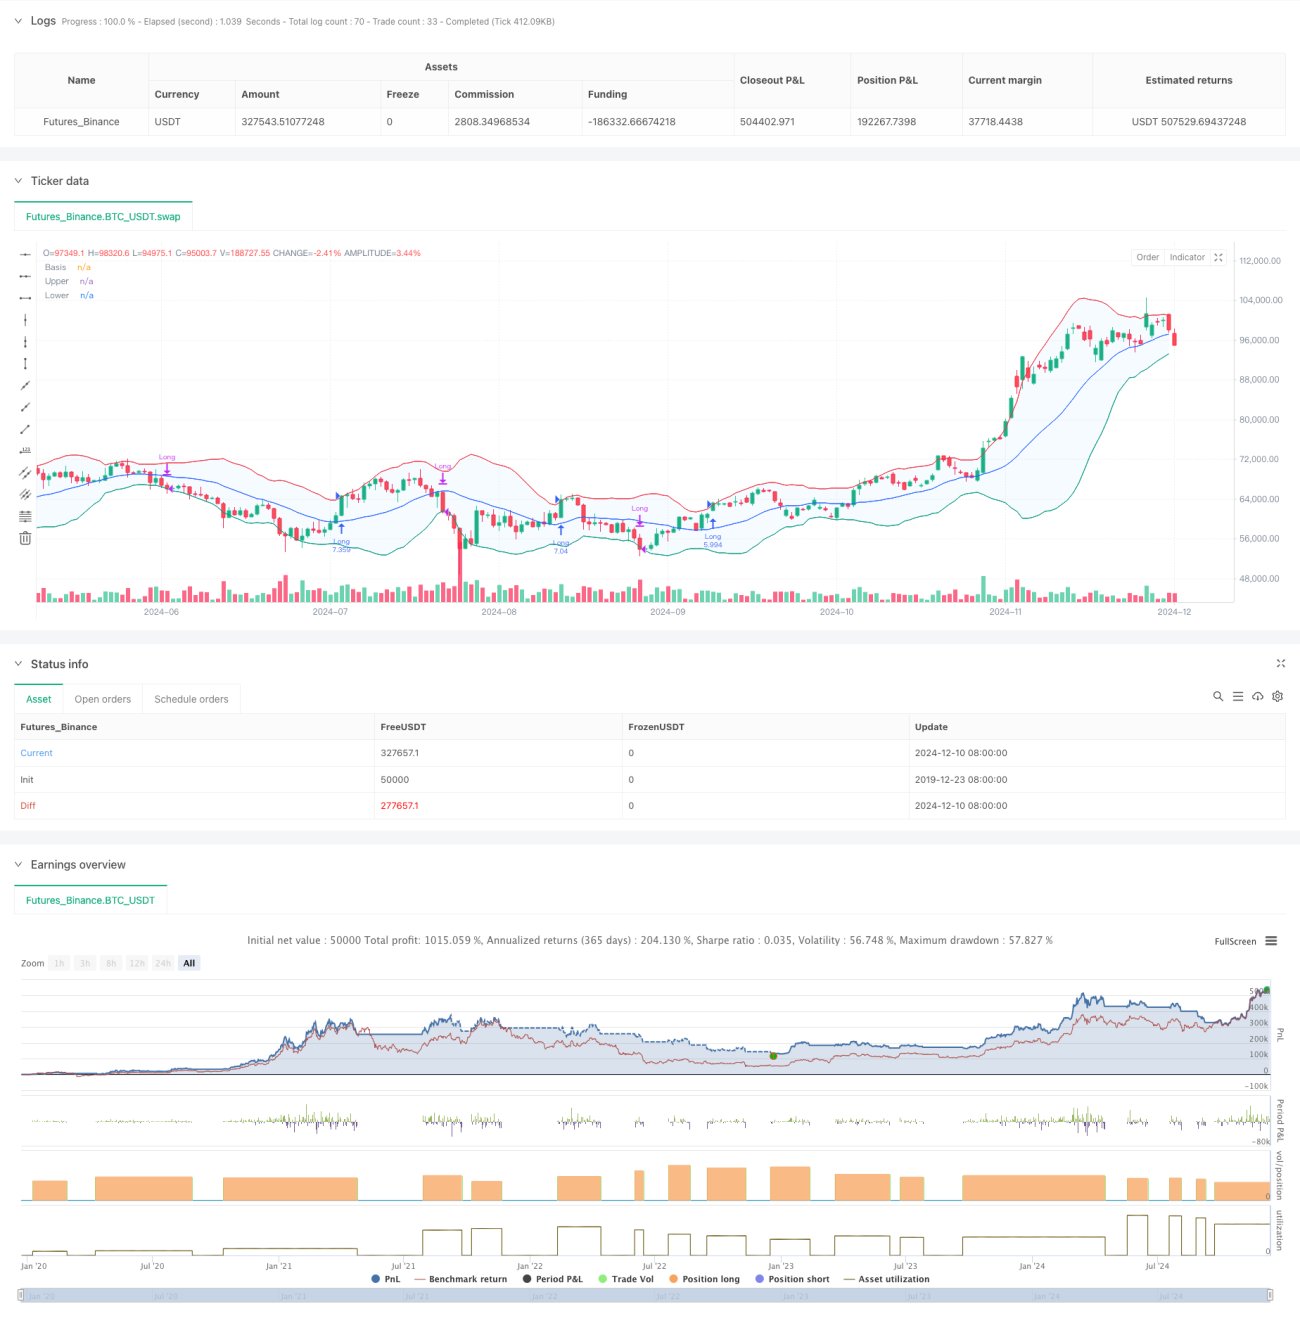
이 전략은 볼링거 밴드 (Bollinger Bands) 에 기반한 동력 돌파 거래 시스템으로, 주로 가격과 볼링거 밴드 (Bollinger Bands) 의 궤도에 대한 관계를 통해 트렌드적 기회를 포착한다. 이 전략은 시장의 변동 특성을 식별하기 위해 표준 차차 통로와 결합된 적응형 일률형 유형 선택 메커니즘을 채택하고 있으며, 특히 변동성이 높은 시장 환경에서 적용된다.
전략 원칙
전략의 핵심 논리는 다음과 같은 핵심 요소에 기초합니다.
- 사용자 정의 가능한 이동 평균을 사용하여 (SMA, EMA, SMMA, WMA, VWMA 포함) 폴링그 대역의 중궤도를 계산한다.
- 표준 차이의 배수 ((설정값 2.0)) 를 통해 동적으로 오르락 내리락의 위치를 결정한다.
- 가격 돌파 경로에 더 많은 입장이 이루어지는 것은 강력한 돌파 트렌드가 형성되는 것을 나타냅니다.
- 가격이 하향으로 떨어질 때 평점 입장은 상승 추세가 끝났을 수 있음을 나타냅니다.
- 이 시스템은 거래비용 ((0.1%) 와 슬라이드 포인트 ((3점)) 을 고려하여 실제 거래 환경에 더 적합합니다.
전략적 이점
- 적응력: 여러 가지 평균선 유형을 선택하여 전략은 다른 시장 조건에 적응할 수 있습니다.
- 위험 제어: 폴링거의 하단 레일을 스톱포인트로 사용하여 명확한 위험 통제를 제공합니다.
- 자금 관리 합리적인: 위치 비율 관리 방식을 채택, 고정 수 수와 관련된 위험을 피한다.
- 거래 비용은 충분히 고려된다: 수수료와 슬라이드 포인트 요소를 포함하고, 재검토 결과는 현실에 더 가깝다.
- 시간 프레임 유연성: 특정 거래 시간 범위를 선택하여 매개 변수를 설정할 수 있습니다.
전략적 위험
- 가짜 브레이크 위험: 불안한 시장에서 빈번하게 가짜 브레이크 신호가 발생할 수 있다.
해결책: 확인 지표를 추가하거나 출입을 지연하는 메커니즘을 추가할 수 있습니다. - 트렌드 반전 위험: 강한 트렌드 시장이 갑자기 변하면 큰 손실이 발생할 수 있습니다.
해결책: 트렌드 강도 필터를 추가할 수 있습니다. - 매개변수 민감도: 매개변수 조합이 다르면 전략 성과에 큰 차이가 생길 수 있습니다.
해결책: 충분한 변수 최적화 및 안정성 테스트가 필요합니다.
전략 최적화 방향
- 트렌드 강도 지표를 소개합니다.
- ADX 또는 비슷한 지표가 추가되어 약한 트렌드 시장의 신호를 필터링 할 수 있습니다.
- 이런 식으로 가짜 침입으로 인한 피해를 줄일 수 있습니다.
- 손해배상 제도를 최적화합니다.
- 트래킹 스로퍼와 같은 동적 스로퍼를 구현할 수 있습니다.
- 트렌드가 지속될 때 더 많은 수익을 얻을 수 있도록 도와줍니다.
- 트랜잭션 필터를 추가하세요:
- 거래량에 기반한 확인 신호
- 유동성이 낮은 환경에서 거래하는 것을 피하십시오.
- "이런 일이 벌어질 수 있다.
- 리콜을 위한 메커니즘을 추가할 수 있습니다.
- 더 나은 입장료를 받을 수 있게 도와줍니다.
요약하다
이것은 합리적이고 논리적으로 명확하게 설계된 트렌드 추적 전략이다. 그것은 볼링거 밴드의 역동적인 특성을 통해 시장 동력을 포착하고, 좋은 위험 제어 메커니즘을 가지고 있다. 전략은 커스터마이징성이 강하며, 매개 변수를 조정하여 서로 다른 시장 환경에 적응할 수 있다. 실장 적용 시 충분한 매개 변수 최적화 및 재검토를 수행하고, 권장된 최적화 방향과 결합하여 전략 개선을 수행하는 것이 좋습니다.
Source
Pine
/*backtest
start: 2019-12-23 08:00:00
end: 2024-12-11 08:00:00
period: 1d
basePeriod: 1d
exchanges: [{"eid":"Futures_Binance","currency":"BTC_USDT"}]
*/

//@version=5
strategy("Demo GPT - Bollinger Bands", overlay=true, initial_capital=10000, commission_type=strategy.commission.percent, commission_value=0.1, slippage=3, default_qty_type=strategy.percent_of_equity, default_qty_value=100)

// InputsStrategy parameters
Related strategies
Comment
All comments (0)
No data
- 1