블랙스완 변동성 및 이동평균 교차 모멘텀 추적 전략

1
Follow
1781
Followers
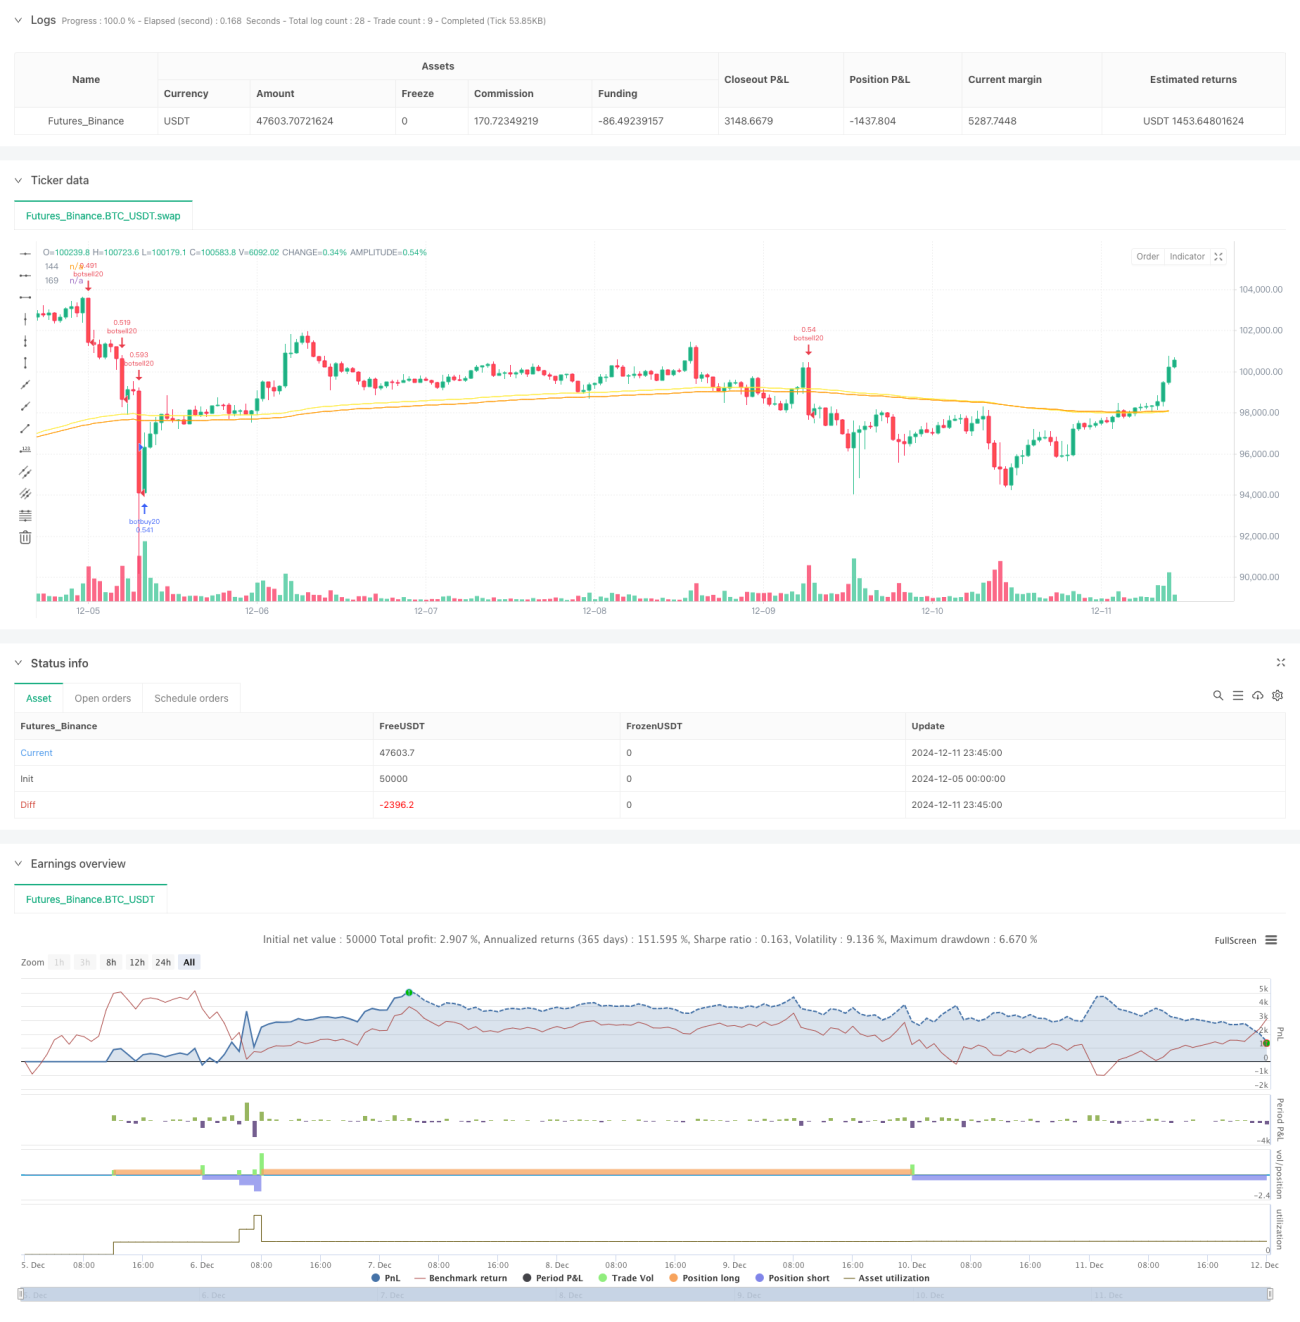
개요
이 전략은 가격 변동의 폭과 평균선 교차에 기반한 동적 추적 거래 시스템이다. 전략은 주로 가격 변동의 비율이 1.91% 이상인 비정상적인 변동 ("검은 천둥 사건") 을 모니터링하여 신호를 유발하며, EMA144와 EMA169의 교차와 결합하여 트렌드 방향과 퇴출 시간을 확인한다. 전략은 특히 1-3 분 단기 거래에 적합하며, 시장의 급격한 변동 기회를 빠르게 포착할 수 있다.
전략 원칙
이 전략의 핵심 논리는 크게 두 가지로 이루어져 있습니다.
- 변동률 모니터링: 마감 가격과 개시 가격의 절대적 차이를 계산하여 마감 가격의 비율에 대해 가격 변동성을 측정하고, 비율이 1.91%를 초과하면 거래 신호를 발동합니다.
- 트렌드 확인: EMA144와 EMA169의 교차를 사용하여 트렌드 방향을 확인하고, 교차 상향은 더 많이 하고, 교차 하향은 공백을 한다. 또한 SMA60과 SMA20을 보조 지표로 도입했다.
전략은 1.91% 이상의 상승 변동이 감지되면 더 많이 실행하고, 하향 변동이 감지되면 공백을 수행합니다. 평선이 역으로 교차 할 때 전략은 위험을 제어하기 위해 자동으로 평정합니다.
전략적 이점
- 신속한 반응: 전략은 시장의 급격한 변동성을 적시에 포착할 수 있으며, 특히 단기 거래에 적합하다.
- 위험 제어: 평행선 교차를 평점 신호로 사용하여 포지션 위험을 효과적으로 제어한다.
- 높은 유연성: 전략은 재검토 시간 범위와 매개 변수를 설정할 수 있으며, 시장 상황에 따라 최적화할 수 있다.
- 완벽한 포지션 관리: 계좌의 순자치 비율을 사용하여 포지션 통제를 수행하고 최대 3 배의 피라미드 부가 포지션을 지원한다.
전략적 위험
- 가짜 브레이크 위험: 높은 변동성 시장에서 가짜 신호가 발생하여 불필요한 거래가 발생할 수 있습니다.
- 슬라이드 포인트 위험: 전략이 짧은 기간 동안 작동하기 때문에 큰 슬라이드 포인트 손실이 발생할 수 있습니다.
- 트렌드 반전 위험: 급격한 변동 이후 트렌드가 급격히 반전될 수 있는 상황.
- 매개 변수 민감성: 전략 효과는 매개 변수 설정에 민감하며, 다른 시장 조건에 따라 자주 조정할 필요가 있다.
전략 최적화 방향
- 변동율 필터를 도입: ATR 지표를 추가하여 시장 소음을 필터링하여 신호 품질을 향상시키는 것이 좋습니다.
- 입학 시점을 최적화: 입학 정확성을 높이기 위해 입학 수를 확인하는 것을 고려할 수 있습니다.
- 동적 조정 매개 변수: 시장 상황에 따라 자동으로 촉발 <unk>값을 조정하는 적응 매개 변수 시스템을 개발하는 것이 좋습니다.
- 손해 방지 제도를 개선: 기존의 수익을 더 잘 보호하기 위해 손해 방지 추적 기능을 추가하는 것이 좋습니다.
요약하다
이 전략은 변동률 모니터링과 평행선 교차를 결합하여 시장의 비정상적인 변동에 대한 신속한 반응과 트렌드 추적을 구현한다. 전략은 합리적으로 설계되어 있으며, 좋은 위험 제어 메커니즘을 갖추고 있지만, 여전히 거래자가 실제 시장 상황에 따라 매개 변수를 최적화하고 위험을 관리해야 한다. 실물 거래에서 작은 포지션에서 시작하여 다양한 시장 환경에서 전략을 점진적으로 검증하는 것이 좋습니다.
Source
Pine
Strategy parameters
Related strategies
Comment
All comments (0)
No data
- 1