
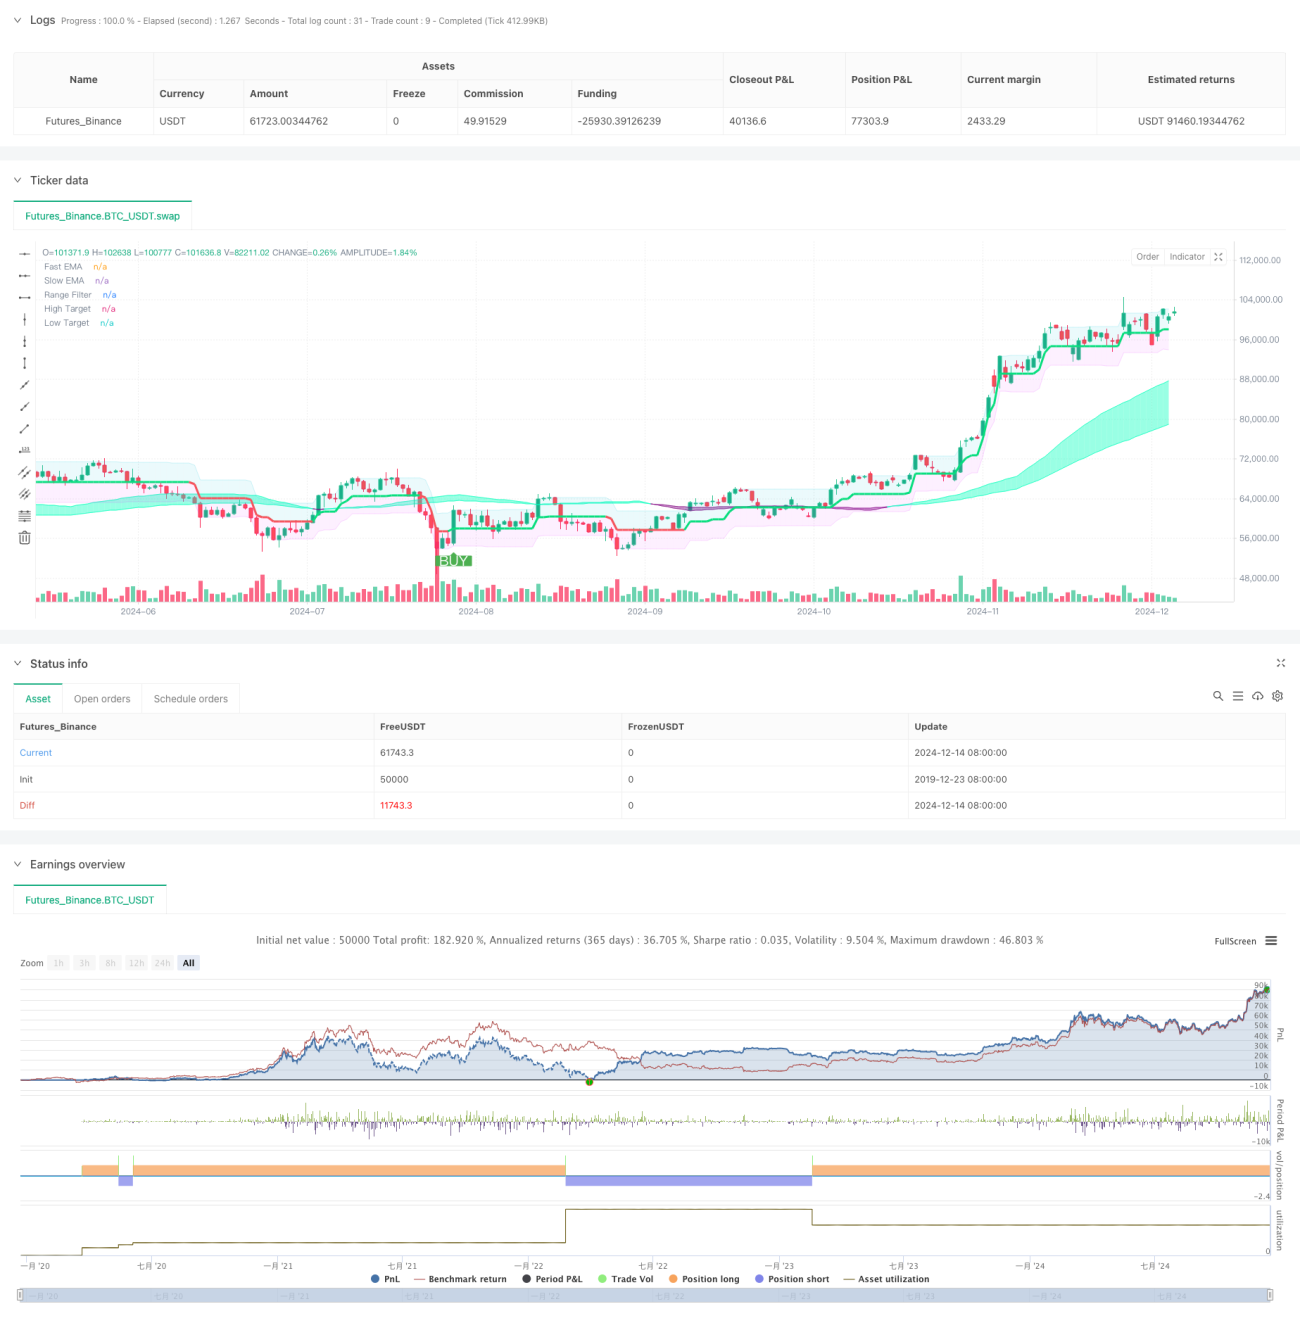
이 전략은 이동 평균과 동적 범위 필터를 결합한 고급 정량 거래 시스템이다. 그것은 주로 가격 변화와 거래량 사이의 관계를 분석하여 시장 추세를 식별하며, 범위 필터를 사용하여 거짓 신호를 필터링하여 거래의 정확성을 향상시킵니다. 이 전략은 시장의 유동성 경계를 결정하기 위해 적응된 계산 방법을 사용하며, 빠른 속도와 느린 이동 평균을 결합하여 트렌드 방향을 확인합니다.
이 전략의 핵심 논리는 다음과 같은 몇 가지 핵심 계산에 기반합니다.
이 전략은 유동성 분석, 트렌드 추적 및 범위 필터를 결합하여 완전한 정량 거래 시스템을 구축합니다. 이 전략은 시장 변화에 적응하고 신뢰할 수있는 거래 신호를 제공 할 수 있다는 장점이 있지만, 변수 최적화 및 위험 관리에 주의를 기울여야합니다. 지속적인 최적화 및 개선으로 이 전략은 다양한 시장 환경에서 안정적인 성능을 유지할 수 있습니다.
/*backtest
start: 2019-12-23 08:00:00
end: 2024-12-15 08:00:00
period: 1d
basePeriod: 1d
exchanges: [{"eid":"Futures_Binance","currency":"BTC_USDT"}]
*/
//@version=6
strategy("Killer Coin V2 + Range Filter Strategy", shorttitle="KC-RF Strategy", overlay=true
)
// === INPUT BACKTEST RANGE ===
useDate = input(true, title='---------------- Use Date ----------------', group="Backtest Settings")
FromMonth = input.int(7, title="From Month", minval=1, maxval=12, group="Backtest Settings")
FromDay = input.int(25, title="From Day", minval=1, maxval=31, group="Backtest Settings")
FromYear = input.int(2019, title="From Year", minval=2017, group="Backtest Settings")
ToMonth = input.int(1, title="To Month", minval=1, maxval=12, group="Backtest Settings")
ToDay = input.int(1, title="To Day", minval=1, maxval=31, group="Backtest Settings")
ToYear = input.int(9999, title="To Year", minval=2017, group="Backtest Settings")
start = timestamp(FromYear, FromMonth, FromDay, 00, 00)
finish = timestamp(ToYear, ToMonth, ToDay, 23, 59)
window() => time >= start and time <= finish
// === KILLER COIN V2 INPUTS ===
outlierThreshold = input.int(10, "Outlier Threshold Length", group="Killer Coin Settings")
fastMovingAverageLength = input.int(50, "Fast MA length", group="Killer Coin Settings")
slowMovingAverageLength = input.int(100, "Slow MA length", group="Killer Coin Settings")
// === RANGE FILTER INPUTS ===
sources = input(close, "Source", group="Range Filter Settings")
isHA = input(false, "Use HA Candles", group="Range Filter Settings")
per = input.int(50, "Sampling Period", minval=1, group="Range Filter Settings")
mult = input.float(3.0, "Range Multiplier", minval=0.1, group="Range Filter Settings")
// === KILLER COIN V2 CALCULATIONS ===
priceMovementLiquidity = volume / math.abs(close - open)
liquidityBoundary = ta.ema(priceMovementLiquidity, outlierThreshold) + ta.stdev(priceMovementLiquidity, outlierThreshold)
var liquidityValues = array.new_float(5)
if ta.crossover(priceMovementLiquidity, liquidityBoundary)
array.insert(liquidityValues, 0, close)
fastEMA = ta.ema(array.get(liquidityValues, 0), fastMovingAverageLength)
slowEMA = ta.ema(array.get(liquidityValues, 0), slowMovingAverageLength)
// === RANGE FILTER CALCULATIONS ===
src = isHA ? request.security(ticker.heikinashi(syminfo.tickerid), timeframe.period, sources) : sources
// Smooth Average Range
smoothrng(x, t, m) =>
wper = (t*2) - 1
avrng = ta.ema(math.abs(x - x[1]), t)
smoothrng = ta.ema(avrng, wper)*m
smoothrng
smrng = smoothrng(src, per, mult)
// Range Filter
rngfilt(x, r) =>
rngfilt = x
rngfilt := x > nz(rngfilt[1]) ? ((x - r) < nz(rngfilt[1]) ? nz(rngfilt[1]) : (x - r)) : ((x + r) > nz(rngfilt[1]) ? nz(rngfilt[1]) : (x + r))
rngfilt
filt = rngfilt(src, smrng)
// Filter Direction
upward = 0.0
upward := filt > filt[1] ? nz(upward[1]) + 1 : filt < filt[1] ? 0 : nz(upward[1])
downward = 0.0
downward := filt < filt[1] ? nz(downward[1]) + 1 : filt > filt[1] ? 0 : nz(downward[1])
// Target Bands
hband = filt + smrng
lband = filt - smrng
// === PLOTTING ===
// Killer Coin V2 Plots
bullColor = color.new(#00ffbb, 50)
bearColor = color.new(#800080, 50)
fastPlot = plot(fastEMA, "Fast EMA", color = fastEMA > slowEMA ? bullColor : bearColor)
slowPlot = plot(slowEMA, "Slow EMA", color = fastEMA > slowEMA ? bullColor : bearColor)
fill(fastPlot, slowPlot, color = fastEMA > slowEMA ? bullColor : bearColor)
// Range Filter Plots
filtcolor = upward > 0 ? color.new(color.lime, 0) : downward > 0 ? color.new(color.red, 0) : color.new(color.orange, 0)
filtplot = plot(filt, "Range Filter", color=filtcolor, linewidth=3)
hbandplot = plot(hband, "High Target", color=color.new(color.aqua, 90))
lbandplot = plot(lband, "Low Target", color=color.new(color.fuchsia, 90))
fill(hbandplot, filtplot, color=color.new(color.aqua, 90))
fill(lbandplot, filtplot, color=color.new(color.fuchsia, 90))
// === STRATEGY CONDITIONS ===
// Range Filter Conditions
longCond = ((src > filt) and (src > src[1]) and (upward > 0)) or ((src > filt) and (src < src[1]) and (upward > 0))
shortCond = ((src < filt) and (src < src[1]) and (downward > 0)) or ((src < filt) and (src > src[1]) and (downward > 0))
CondIni = 0
CondIni := longCond ? 1 : shortCond ? -1 : CondIni[1]
longCondition = longCond and CondIni[1] == -1
shortCondition = shortCond and CondIni[1] == 1
// Combined Conditions
finalLongSignal = longCondition and fastEMA > slowEMA and window()
finalShortSignal = shortCondition and fastEMA < slowEMA and window()
// === PLOTTING SIGNALS ===
plotshape(finalLongSignal, "Buy Signal", text="BUY", textcolor=color.white,
style=shape.labelup, size=size.normal, location=location.belowbar,
color=color.new(color.green, 0))
plotshape(finalShortSignal, "Sell Signal", text="SELL", textcolor=color.white,
style=shape.labeldown, size=size.normal, location=location.abovebar,
color=color.new(color.red, 0))
// === STRATEGY ENTRIES ===
if finalLongSignal
strategy.entry("Long", strategy.long, stop=hband)
if finalShortSignal
strategy.entry("Short", strategy.short, stop=lband)
// === ALERTS ===
alertcondition(finalLongSignal, "Strong Buy Signal", "🚨 Buy - Both Indicators Aligned!")
alertcondition(finalShortSignal, "Strong Sell Signal", "🚨 Sell - Both Indicators Aligned!")