다중 기술 지표 추세 추종 및 모멘텀 RSI 필터링 거래 전략

EMA RSI ATR SMA MACD
생성 날짜: 2024-12-20 14:10:43 마지막으로 수정됨: 2024-12-20 14:10:43
복사: 0 클릭수: 410
avatar of ChaoZhang ChaoZhang
1
집중하다
1617
수행원

다중 기술 지표 추세 추종 및 모멘텀 RSI 필터링 거래 전략

개요

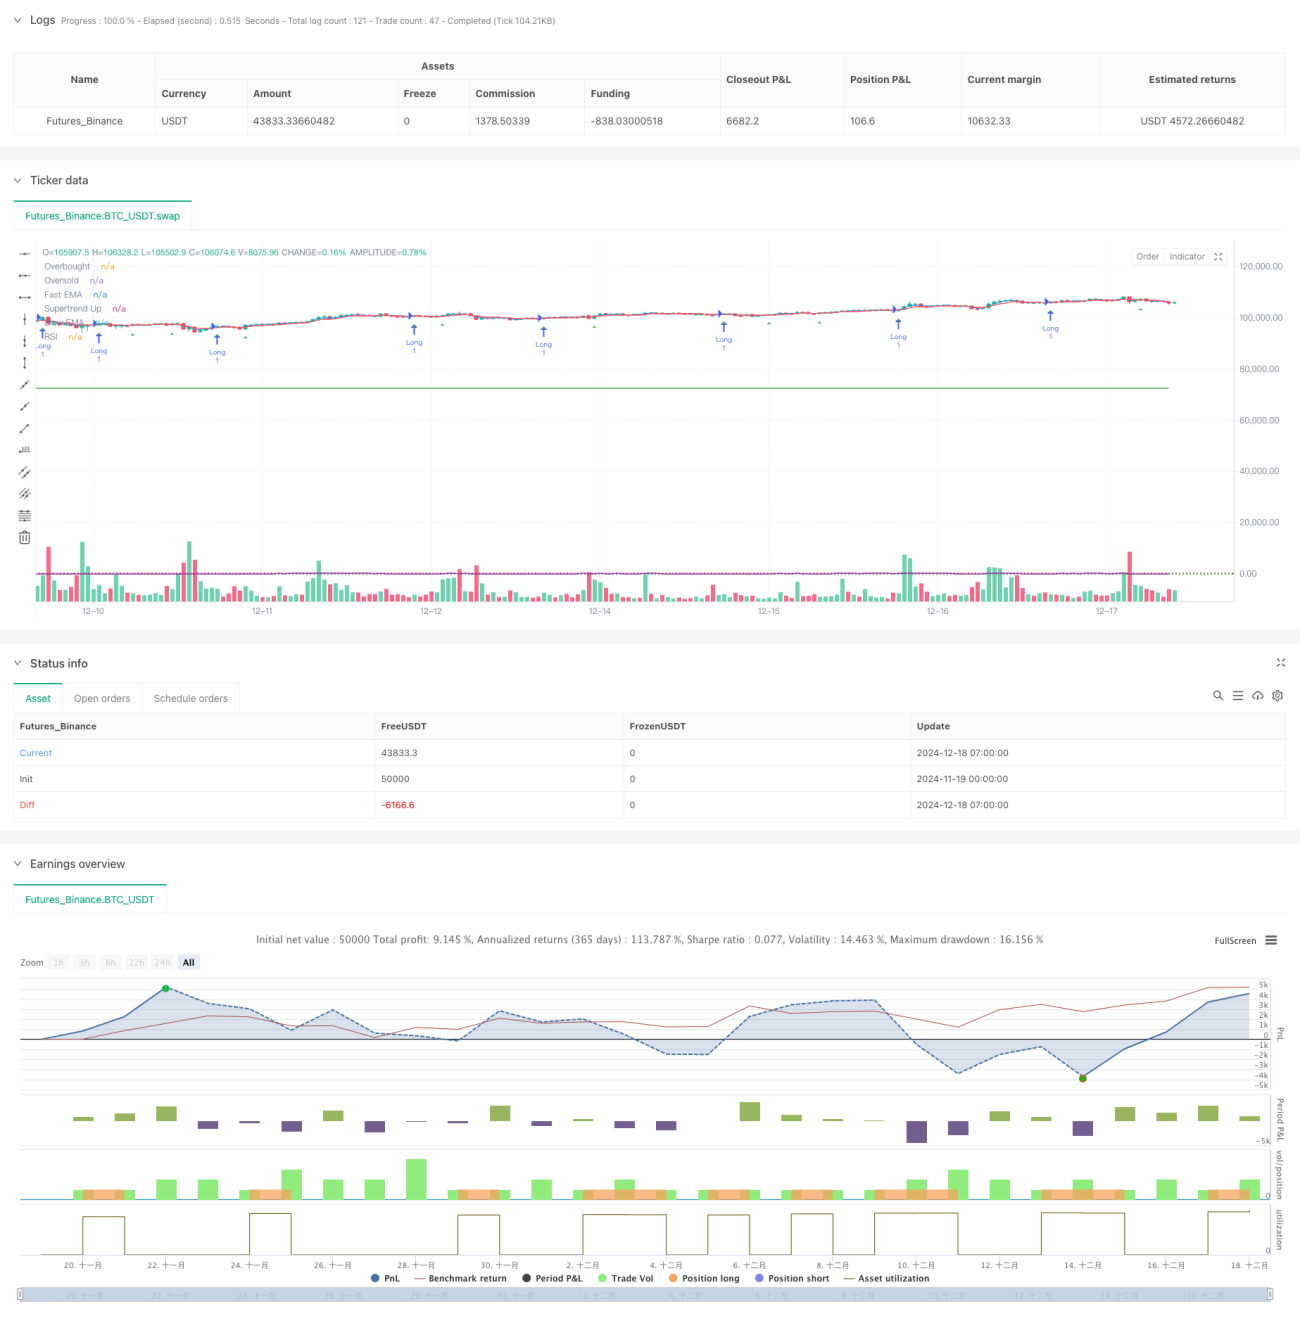
이것은 여러 기술 지표들을 결합한 트렌드 추적 전략으로, 주로 빠른 느린 지수 이동 평균 (EMA) 교차, 슈퍼 트렌드 트렌드 지표, 그리고 상대적으로 강한 지표 (RSI) 를 사용하여 거래 기회를 식별한다. 이 전략은 지표들의 유기적인 결합을 통해 트렌드 추적에 기초하여 동력을 필터링하고, ATR을 동적으로 스톱 포지션을 조정하는 동시에, 완전한 거래 시스템을 구현한다.

전략 원칙

이 전략은 트레이딩 신호를 확인하기 위해 세 가지 필터링 메커니즘을 사용합니다.

  1. EMA 교차 시스템은 단기 트렌드 변화를 포착하기 위해 사용되며, 빠른 EMA 위를 가로지르면 느린 EMA를 가로지르면 다중 신호를 발생시키고, 아래를 가로지르면 공백 신호를 발생한다.
  2. 슈퍼트렌드 지표는 ATR을 기반으로 동적 지원/저항선을 계산하여 전반적인 트렌드 방향을 확인한다. 가격이 슈퍼트렌드 라인 위에 있을 때만 더 많이 할 수 있고, 라인 아래에 있을 때만 더 많이 할 수 있다.
  3. RSI 지표는 과도한 구매 또는 판매를 필터링하는 시장 상태를 사용합니다. RSI가 과매도 영역에 도달하지 않은 경우에만 추가로 허용되며, 과매도 영역에 도달하지 않은 경우에만 공백을 허용합니다.

이 전략은 또한 ATR 기반의 동적 중지 손실 차단 시스템을 포함하고 있으며, 시장의 변동성에 따라 자동으로 위험 관리 매개 변수를 조정할 수 있습니다. 또한 시간 필터를 통해 거래 기간을 제한하여 낮은 유동성 기간의 거래를 방지합니다.

전략적 이점

  1. 다중 기술 지표의 결합은 단일 지표가 가져올 수 있는 잘못된 신호를 피하여 더 신뢰할 수 있는 거래 신호를 제공합니다.
  2. 동적 스톱 스 설정은 다양한 시장 변동 상황에 적응할 수 있으며, 변동성이 큰 경우 거래에 더 많은 호흡 공간을 제공합니다.
  3. RSI 필터링 메커니즘은 시장의 극단적 인 상태에서 출입의 위험을 효과적으로 감소시킵니다.
  4. 시간 필터 기능은 거래자가 특정 거래 시간에 집중할 수 있게 해 주고, 효율성이 낮은 시간에 거래하는 것을 피할 수 있다.

전략적 위험

  1. 여러 가지 필터링 조건으로 인해 잠재적인 거래 기회를 놓칠 수 있습니다.
  2. 빠르게 변동하는 시장에서, 스톱 로즈는 쉽게 만질 수 있다.
  3. 매개 변수를 지나치게 최적화하면 오버피칭 문제가 발생할 수 있다.
  4. 높은 주파수 거래는 높은 거래 비용을 초래할 수 있습니다.

전략 최적화 방향

  1. 추가적인 확인이 될 수 있도록 거래량 지표를 추가하는 것을 고려할 수 있습니다.
  2. 자율적 변수 조정 메커니즘을 도입하여 다양한 시장 환경에 더 잘 적응할 수 있도록합니다.
  3. 트렌드 강도 필터를 추가하여 약한 트렌드 시장에서 과도한 거래를 피하십시오.
  4. 더 지능적인 포지션 관리 시스템을 개발하여 시장 상황에 따라 포지션 비율을 조정합니다.

요약하다

이 전략은 여러 기술 지표와 필터링 조건을 결합하여 비교적 완전한 거래 시스템을 구축한다. 그것의 핵심 장점은 여러 확인 메커니즘과 동적 위험 관리에 있다. 그러나 또한 변수 최적화 및 거래 비용과 같은 문제에 주의를 기울여야 한다. 지속적인 최적화 및 개선으로 이 전략은 다양한 시장 환경에서 안정적인 성능을 유지할 것으로 보인다.

전략 소스 코드
/*backtest
start: 2024-11-19 00:00:00
end: 2024-12-18 08:00:00
period: 1h
basePeriod: 1h
exchanges: [{"eid":"Futures_Binance","currency":"BTC_USDT"}]
*/

//@version=5
strategy(title="Supertrend + EMA Crossover with RSI Filter", shorttitle="ST_EMA_RSI", overlay=true)

// Input parameters for EMA
fastEMA          = input.int(3,  title="Fast EMA Period", minval=1)
slowEMA          = input.int(6,  title="Slow EMA Period", minval=1)
atrLength        = input.int(3,  title="ATR Length", minval=1)

// Using a fixed multiplier for Supertrend calculation
stMultiplier = 1

// Stop loss and take profit multipliers
stopLossATR      = input.float(2.5, title="Stop Loss ATR Multiplier", minval=0.1, step=0.1)
takeProfitATR    = input.float(4,   title="Take Profit ATR Multiplier", minval=0.1, step=0.1)

// RSI inputs
rsiLength      = input.int(10, title="RSI Length", minval=1)
rsiOverbought  = input.float(65, title="RSI Overbought Level", minval=50.0, maxval=100.0)
rsiOversold    = input.float(30.0, title="RSI Oversold Level",   minval=0.0, maxval=50.0)

// Declare the RSI plot toggle input as a global variable
bool rsiPlotEnabled = input.bool(true, title="Show RSI in separate panel")

// Time filter inputs
i_startTime = input(title="Start Filter", defval=timestamp("01 Jan 2023 13:30 +0000"), group="Time Filter", tooltip="Start date & time to begin searching for setups")
i_endTime   = input(title="End Filter",   defval=timestamp("28 Apr 2099 19:30 +0000"), group="Time Filter", tooltip="End date & time to stop searching for setups")

// Date/time filtering logic
inDateRange = true

// Calculate EMAs
fastEMALine = ta.ema(close, fastEMA)
slowEMALine = ta.ema(close, slowEMA)

// Calculate ATR
atr = ta.atr(atrLength)

// Calculate Supertrend using fixed multiplier
up = high - (stMultiplier * atr)
dn = low +  (stMultiplier * atr)

var float trendUp = na
var float trendDown = na
var int trend = na

trendUp   := na(trendUp[1])   ? up : (close[1] > trendUp[1]   ? math.min(up, trendUp[1])   : up)
trendDown := na(trendDown[1]) ? dn : (close[1] < trendDown[1] ? math.max(dn, trendDown[1]) : dn)

trend := close > nz(trendUp[1]) ? 1 : close < nz(trendDown[1]) ? -1 : nz(trend[1], 1)
supertrend = trend == 1 ? trendUp : trendDown

// Calculate RSI
myRSI = ta.rsi(close, rsiLength)

// Entry conditions with RSI filter
longEntryCondition  = ta.crossover(fastEMALine, slowEMALine) and (trend == 1) and (myRSI < rsiOverbought)
shortEntryCondition = ta.crossunder(fastEMALine, slowEMALine) and (trend == -1) and (myRSI > rsiOversold)

// Strategy entries
if inDateRange and longEntryCondition and strategy.position_size <= 0
    strategy.entry("Long", strategy.long)

if inDateRange and shortEntryCondition and strategy.position_size >= 0
    strategy.entry("Short", strategy.short)

// Stops and targets
if strategy.position_size > 0
    longStopLoss   = strategy.position_avg_price - stopLossATR * atr
    longTakeProfit = strategy.position_avg_price + takeProfitATR * atr
    strategy.exit("Long SL/TP", "Long", stop=longStopLoss, limit=longTakeProfit)

if strategy.position_size < 0
    shortStopLoss   = strategy.position_avg_price + stopLossATR * atr
    shortTakeProfit = strategy.position_avg_price - takeProfitATR * atr
    strategy.exit("Short SL/TP", "Short", stop=shortStopLoss, limit=shortTakeProfit)

// Plot EMAs and Supertrend
plot(fastEMALine, title="Fast EMA", color=color.new(color.blue, 0))
plot(slowEMALine, title="Slow EMA", color=color.new(color.red, 0))
plot(trend == 1 ? supertrend : na, title="Supertrend Up", color=color.green, style=plot.style_linebr)
plot(trend == -1 ? supertrend : na, title="Supertrend Down", color=color.red, style=plot.style_linebr)

// Plot RSI and hlines
plot(rsiPlotEnabled ? myRSI : na, title="RSI", color=color.new(color.purple, 0))
hline(rsiOverbought, "Overbought", color=color.red, linestyle=hline.style_dotted)
hline(rsiOversold,   "Oversold",   color=color.green, linestyle=hline.style_dotted)

// Plot entry signals
plotshape(longEntryCondition, title="Long Entry Signal", style=shape.triangleup, location=location.belowbar, size=size.tiny, color=color.new(color.green, 0))
plotshape(shortEntryCondition, title="Short Entry Signal", style=shape.triangledown, location=location.abovebar, size=size.tiny, color=color.new(color.red, 0))