다중 추세선 돌파 교차 양적 전략

1
Follow
1781
Followers
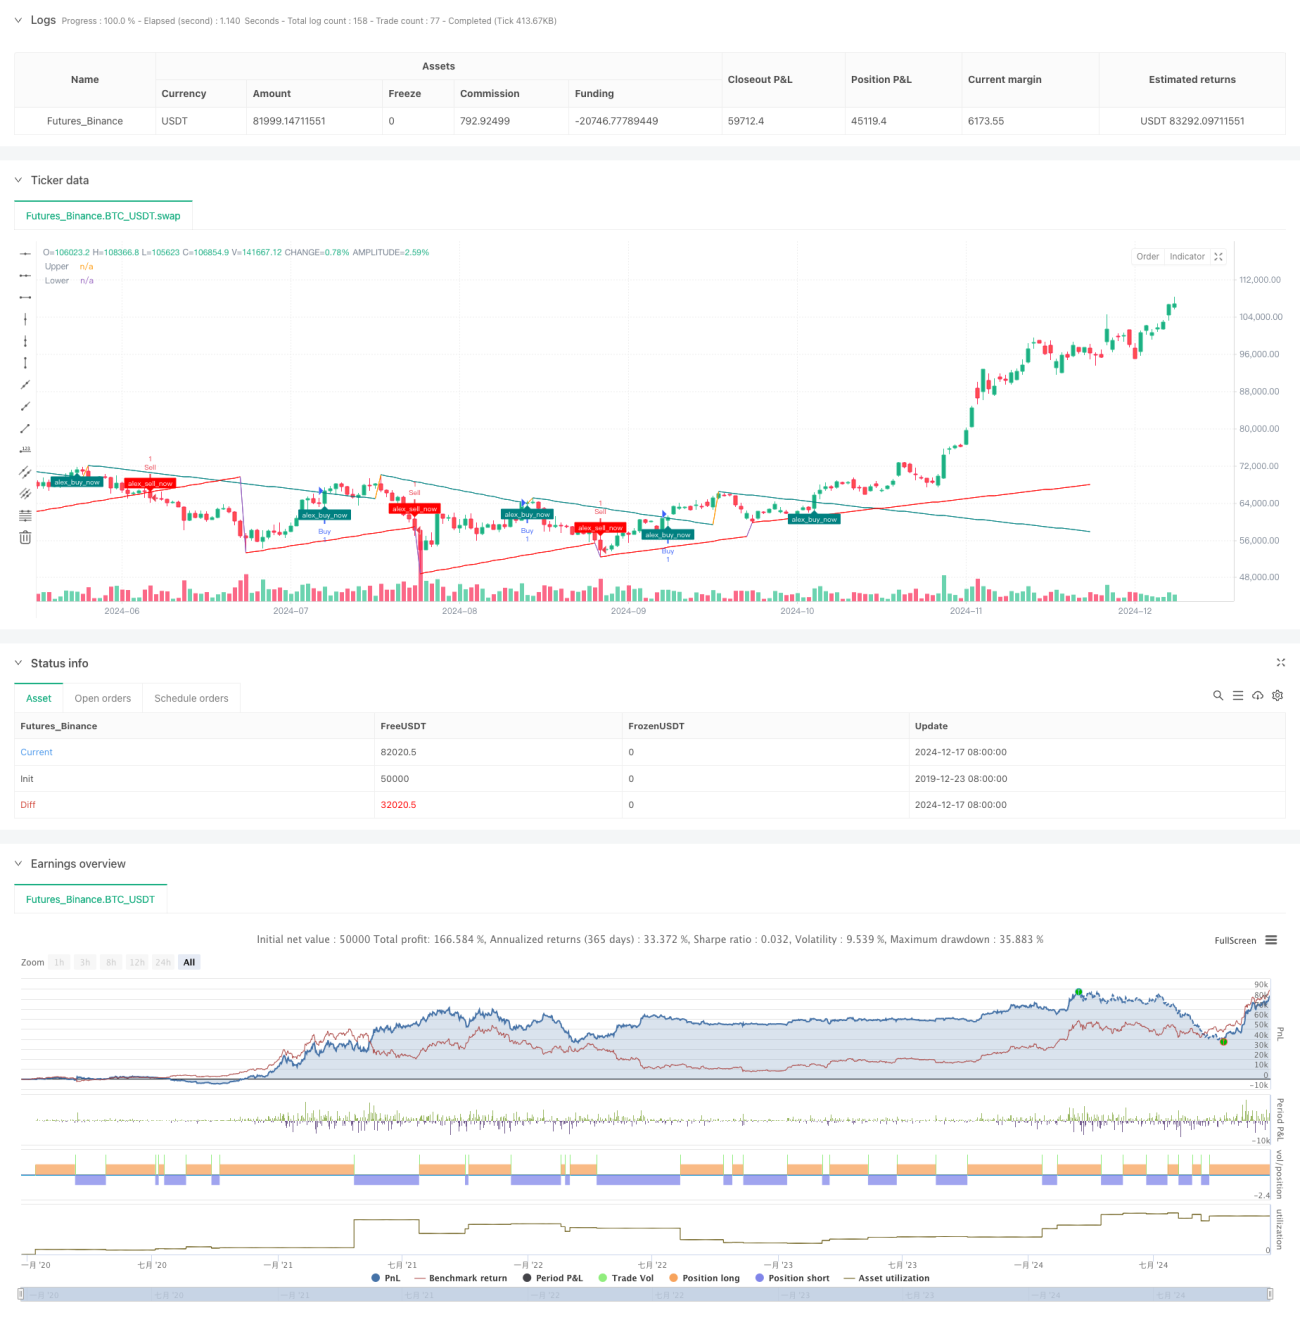
전략 개요
이 전략은 다중 트렌드 라인 브레이크를 기반으로 하는 지능형 거래 시스템이다. 그것은 동적으로 중요한 지지 저항 지점을 식별하고, 여러 기술 지표와 결합하여 트렌드 라인 경사도를 계산하여 가격이 트렌드 라인 브레이크를 할 때 거래한다. 이 전략은 시장 추세의 전환점을 포착할 수 있을 뿐만 아니라, 파라미터를 최적화하여 다른 시장 환경에 적응할 수 있다.
전략 원칙
전략의 핵심 논리는 세 가지 주요 부분으로 구성됩니다. 첫째, 초기 지지 저항 지점을 형성하는 중요한 고위와 낮은 지점을 후퇴 기간 (Lookback Period) 을 통해 식별합니다. 둘째, 트렌드 라인의 기울기를 선택된 계산 방법 (ATR, 표준 차차 또는 선형 회귀) 에 따라 동적으로 계산하여 트렌드 라인이 시장의 변동에 더 잘 적응하도록합니다. 마지막으로, 가격과 트렌드 라인의 관계를 모니터링하여 돌파구가 발생했을 때 거래 신호를 유발합니다.
전략적 이점
- 적응성: 다양한 기울기 계산 방법과 조정 가능한 매개 변수를 통해 전략은 다양한 시장 환경에 적응할 수 있습니다.
- 리스크 제어: 트렌드 라인의 동적 조정 능력은 트렌드 변화를 제 시간에 식별하고 가짜 돌파구로 인한 손실을 줄일 수 있습니다.
- 좋은 시각화 효과: 트렌드 라인 연장 및 브레이크 마크를 포함한 명확한 시각적 피드백을 제공하는 전략
- 신호 확인 메커니즘: 다중 조건 검증을 통해 거래 신호의 신뢰성을 보장합니다.
전략적 위험
- 시장의 급격한 변동으로 인해 잘못된 신호가 발생할 수 있습니다.
- 트렌드 라인 계산의 지연성으로 인해 출입 시기가 약간 늦어질 수 있습니다.
- 잘못 선택된 매개 변수는 과도한 거래 또는 중요한 기회를 놓칠 수 있습니다.
- 수평 정리 시장에서 빈번한 가짜 브레이크 신호가 발생할 수 있습니다.
전략 최적화 방향
- 진출의 유효성을 검증하기 위한 트랜스포트 지표 도입
- 시장 변동율 필터를 추가하여 높은 변동 동안 변수를 조정합니다.
- 신호의 정확성을 높이기 위해 다른 기술 지표를 통합
- 자율적인 변수 조정 메커니즘을 개발
- 스톱로스와 수익을 증가시키는 지능형 계산 방법
요약하다
이 전략은 여러 가지 기술적 분석 방법을 통합하여 신뢰할 수 있는 트렌드 라인을 깨는 거래 시스템을 구축합니다. 이 전략의 장점은 시장 변화에 동적으로 적응할 수 있다는 점과 동시에 명확한 거래 신호를 제공하는 것입니다. 일부 고유한 위험이 있지만 합리적인 매개 변수 설정과 지속적인 최적화를 통해 전략의 안정성과 수익성을 크게 향상시킬 수 있습니다.
Source
Pine
/*backtest
start: 2019-12-23 08:00:00
end: 2024-12-18 08:00:00
period: 1d
basePeriod: 1d
exchanges: [{"eid":"Futures_Binance","currency":"BTC_USDT"}]
*/

// This Pine Script™ code is subject to the terms of the Mozilla Public License 2.0 at https://mozilla.org/MPL/2.0/
// © Alexgoldhunter

//@version=5Strategy parameters
Related strategies
Comment
All comments (0)
No data
- 1