
1
Follow
1802
Followers
개요
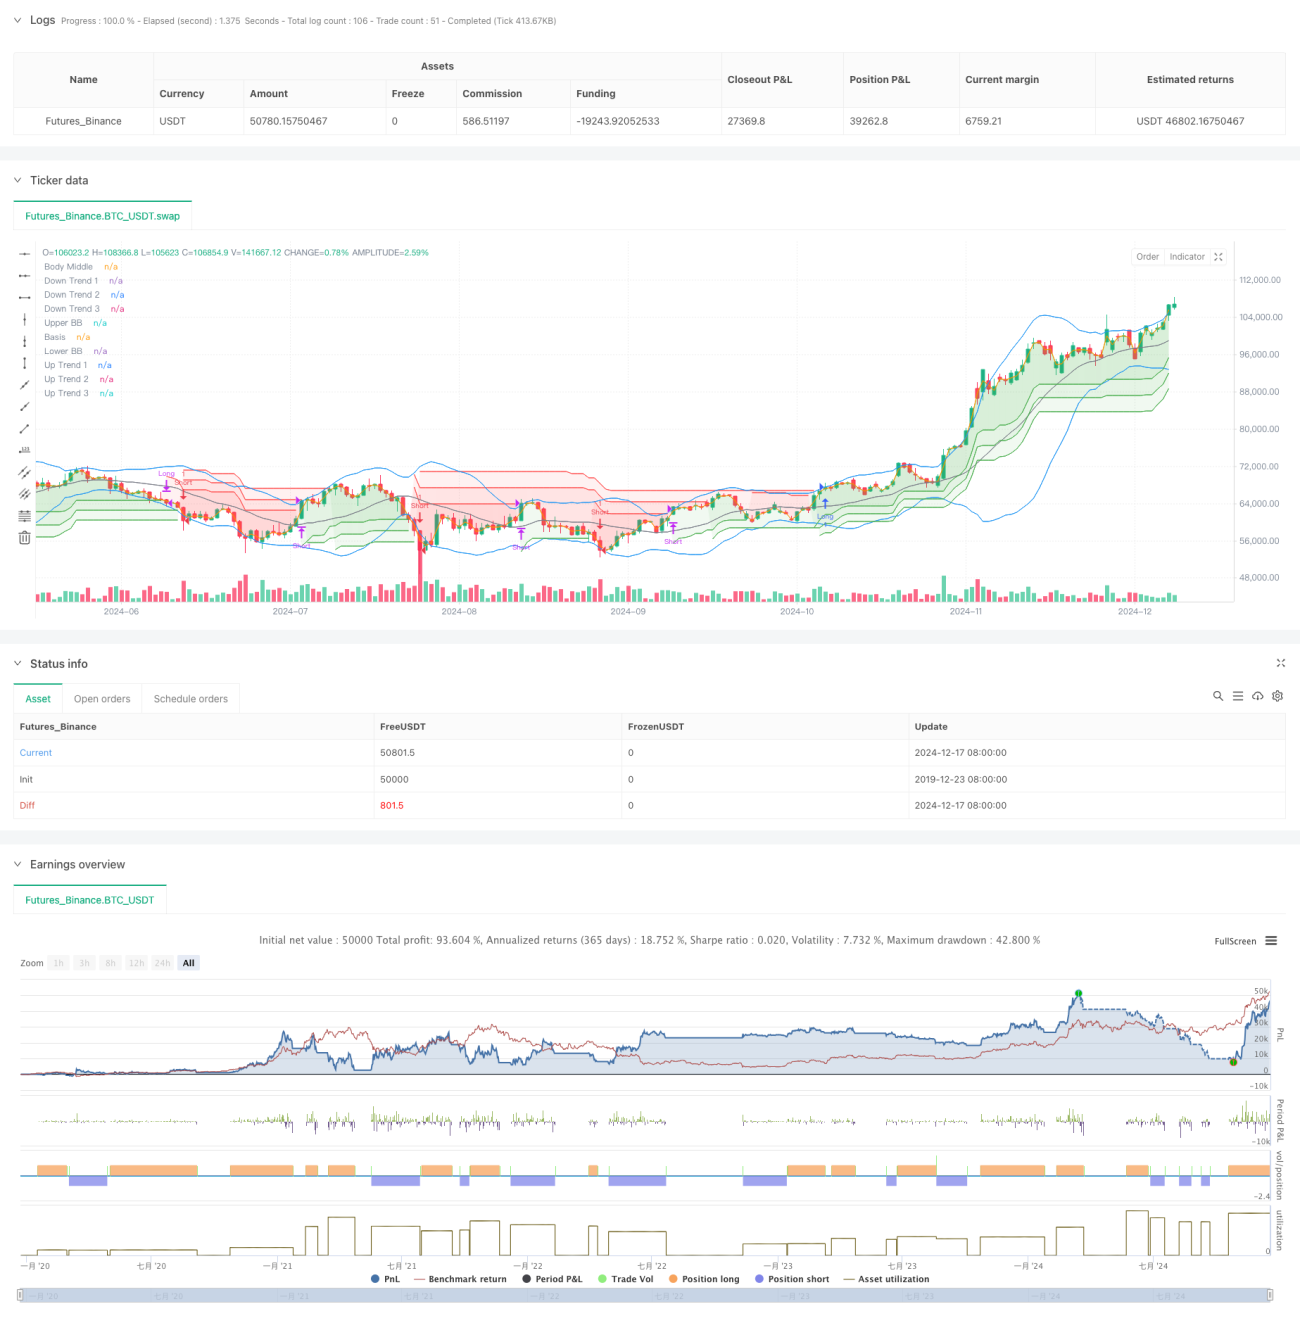
본 전략은 볼린저 밴드와 트리플 수퍼트렌드 지표를 결합하여 거래를 수행합니다. 볼린저 밴드의 변동성 구간 판단과 트리플 수퍼트렌드의 추세 확정을 통해 강건한 추세 추종 시스템을 구축합니다. 볼린저 밴드는 가격의 극단적 변동을 식별하고, 트리플 수퍼트렌드는 서로 다른 매개변수 설정을 통해 추세 방향에 대한 다중 확인을 제공합니다. 모든 신호가 일치할 때만 거래를 실행하여 허위 신호의 위험을 줄입니다. 이러한 결합 방식은 추세 추종의 장점을 유지하면서 거래의 신뢰성을 높입니다.
전략 원리
전략의 핵심 로직은 다음의 주요 부분으로 구성됩니다:
- 20주기 볼린저 밴드 사용, 표준편차 배수 2.0으로 가격 변동성 판단
- 세 개의 수퍼트렌드 라인 설정, 주기 10, 매개변수 각각 3.0, 4.0, 5.0
- 매수 진입 조건: 가격이 볼린저 밴드 상한선을 돌파하고 세 개의 수퍼트렌드 라인이 모두 상승 추세를 나타낼 때
- 매도 진입 조건: 가격이 볼린저 밴드 하한선을 하향 돌파하고 세 개의 수퍼트렌드 라인이 모두 하락 추세를 나타낼 때
- 임의의 수퍼트렌드 라인이 방향을 전환하면 현재 포지션 청산
- 중간 가격선을 채움 참조로 사용하여 시각적 효과 강화
전략 장점
- 다중 확인 메커니즘: 볼린저 밴드와 트리플 수퍼트렌드의 조합으로 허위 신호 대폭 감소
- 추세 추종 능력 우수: 수퍼트렌드 지표의 점진적 매개변수 설정으로 다양한 수준의 추세 효과적으로 포착
- 리스크 관리 완벽: 추세 전환 조짐이 나타나면 빠르게 청산하여 하락 위험 통제
- 매개변수 조정 가능성 높음: 각 지표의 매개변수를 시장 특성에 따라 최적화 가능
- 자동화 수준 높음: 전략 로직이 명확하여 체계적 구현 용이
전략 리스크
- 횡보장 리스크: 박스권 장세에서 잦은 가짜 돌파 신호 발생 가능
- 슬리피지 영향: 급변동 기간 중 큰 슬리피지 손실 직면 가능
- 지연 리스크: 다중 확인 메커니즘으로 인해 진입 시점이 다소 늦어질 수 있음
- 매개변수 민감성: 다양한 매개변수 조합에 따라 전략 성과 차이 큼
- 시장 환경 의존성: 추세가 뚜렷한 시장에서 더 좋은 성과
전략 최적화 방향
- 거래량 지표 도입: 거래량을 통해 가격 돌파 유효성 확인
- 손절 메커니즘 최적화: 이동 손절 또는 ATR 기반 동적 손절 추가 가능
- 시간 필터 추가: 특정 시간대 거래 금지로 비효율적 변동 회피
- 변동성 필터 포함: 과도한 변동성 기간에 포지션 조정 또는 거래 중단
- 매개변수 자동 적응 메커니즘 개발: 시장 상태에 따라 매개변수 동적 조정
요약
이는 볼린저 밴드와 트리플 수퍼트렌드를 결합한 추세 추종 전략으로, 다중 기술 지표 확인을 통해 거래의 신뢰성을 높입니다. 이 전략은 강력한 추세 포착 능력과 리스크 관리 능력을 갖추고 있으나, 시장 환경이 전략 성과에 미치는 영향에 주의해야 합니다. 지속적인 최적화와 개선을 통해 다양한 시장 조건에서도 안정적인 성과를 유지할 수 있을 것으로 기대됩니다. 실전 거래 전 충분한 백테스트와 매개변수 최적화를 수행하고, 시장 실제 상황에 맞춰 적절히 조정하는 것을 권장합니다.
Source
Pine
//@version=5
strategy("Demo GPT - Bollinger + Triple Supertrend Combo", overlay=true, commission_type=strategy.commission.percent, commission_value=0.1, slippage=3)

// -------------------------------
// User Input for Date Range
// -------------------------------
startDate = input(title="Start Date", defval=timestamp("2018-01-01 00:00:00"))
endDate   = input(title="End Date",   defval=timestamp("2069-12-31 23:59:59"))

// -------------------------------
// Bollinger Band Inputs
// -------------------------------Strategy parameters
Comment
All comments (0)
No data
- 1