
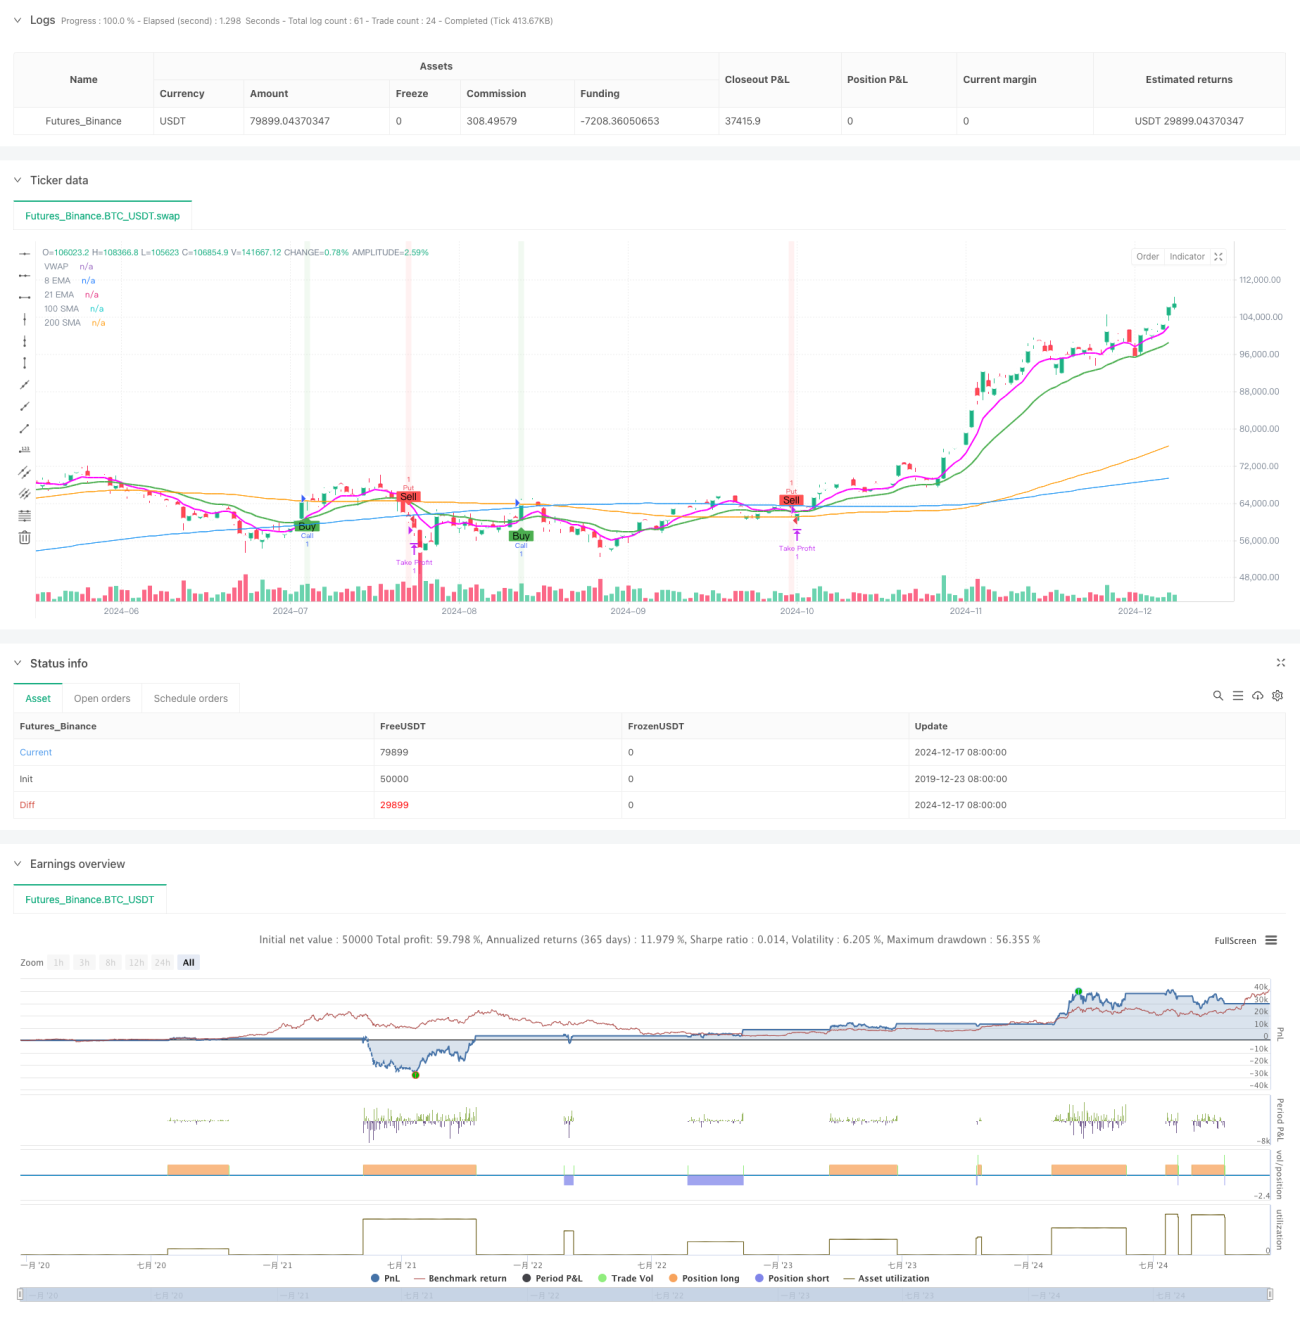
이 전략은 여러 기술적 지표의 조합에 기반한 트렌드 추적 옵션 거래 전략이다. 주로 EMA 교차를 핵심 신호로 사용하여 SMA, VWAP와 결합하여 트렌드 방향을 확인하고 MACD와 RSI를 보조 지표로 사용하여 신호 필터링을 수행한다. 전략은 고정 정지점 리스크 관리를 채택하여 엄격한 입시 조건과 위치 관리를 통해 거래의 성공률을 높인다.
전략은 8주기 및 21주기 EMA의 교차를 주요 거래 신호로 사용하며, 단기 EMA에서 장기 EMA를 뚫고 다음과 같은 조건을 충족하면 여러 신호를 유발합니다: 가격은 100과 200주기 SMA 위에 있고, MACD 라인은 신호 라인 위에 있으며, RSI는 50보다 크다. 이 신호의 촉발 조건은 반대입니다. 전략은 VWAP를 가격 중량 참조로 도입하여 현재 가격의 상대적 위치를 판단하는 데 도움이됩니다.
이 전략은 여러 기술 지표의 조화를 통해 거래 신호의 신뢰성을 높이고, 고정 스톱 포인트 지점을 사용하여 위험을 관리합니다. 전략에는 몇 가지 고유한 위험이 있지만, 제안 된 최적화 방향은 전략의 안정성과 수익성을 더욱 향상시킬 수 있습니다. 전략의 시각적 설계는 거래자가 거래 신호를 직관적으로 이해하고 실행하는 데 도움이됩니다.
/*backtest
start: 2019-12-23 08:00:00
end: 2024-12-18 08:00:00
period: 1d
basePeriod: 1d
exchanges: [{"eid":"Futures_Binance","currency":"BTC_USDT"}]
*/
//@version=5
strategy("OptionsMillionaire Strategy with Take Profit Only", overlay=true, default_qty_type=strategy.fixed, default_qty_value=1)
// Define custom magenta color
magenta = color.rgb(255, 0, 255) // RGB for magenta
// Input settings for Moving Averages
ema8 = ta.ema(close, 8)
ema21 = ta.ema(close, 21)
sma100 = ta.sma(close, 100)
sma200 = ta.sma(close, 200)
vwap = ta.vwap(close) // Fixed VWAP calculation
// Input settings for MACD and RSI
[macdLine, signalLine, _] = ta.macd(close, 12, 26, 9)
rsi = ta.rsi(close, 14)
// Define trend direction
isBullish = ema8 > ema21 and close > sma100 and close > sma200
isBearish = ema8 < ema21 and close < sma100 and close < sma200
// Buy (Call) Signal
callSignal = ta.crossover(ema8, ema21) and isBullish and macdLine > signalLine and rsi > 50
// Sell (Put) Signal
putSignal = ta.crossunder(ema8, ema21) and isBearish and macdLine < signalLine and rsi < 50
// Define Position Size and Take-Profit Level
positionSize = 1 // Position size set to 1 (each trade will use one contract)
takeProfitPercent = 5 // Take profit is 5%
// Variables to track entry price and whether the position is opened
var float entryPrice = na // To store the entry price
var bool positionOpen = false // To check if a position is open
// Backtesting Execution
if callSignal and not positionOpen
// Enter long position (call)
strategy.entry("Call", strategy.long, qty=positionSize)
entryPrice := close // Store the entry price
positionOpen := true // Set position as opened
if putSignal and not positionOpen
// Enter short position (put)
strategy.entry("Put", strategy.short, qty=positionSize)
entryPrice := close // Store the entry price
positionOpen := true // Set position as opened
// Only check for take profit after position is open
if positionOpen
// Calculate take-profit level (5% above entry price for long, 5% below for short)
takeProfitLevel = entryPrice * (1 + takeProfitPercent / 100)
// Exit conditions (only take profit)
if strategy.position_size > 0
// Long position (call)
if close >= takeProfitLevel
strategy.exit("Take Profit", "Call", limit=takeProfitLevel)
if strategy.position_size < 0
// Short position (put)
if close <= takeProfitLevel
strategy.exit("Take Profit", "Put", limit=takeProfitLevel)
// Reset position when it is closed (this happens when an exit is triggered)
if strategy.position_size == 0
positionOpen := false // Reset positionOpen flag
// Plot EMAs
plot(ema8, color=magenta, linewidth=2, title="8 EMA")
plot(ema21, color=color.green, linewidth=2, title="21 EMA")
// Plot SMAs
plot(sma100, color=color.orange, linewidth=1, title="100 SMA")
plot(sma200, color=color.blue, linewidth=1, title="200 SMA")
// Plot VWAP
plot(vwap, color=color.white, style=plot.style_circles, title="VWAP")
// Highlight buy and sell zones
bgcolor(callSignal ? color.new(color.green, 90) : na, title="Call Signal Background")
bgcolor(putSignal ? color.new(color.red, 90) : na, title="Put Signal Background")
// Add buy and sell markers (buy below, sell above)
plotshape(series=callSignal, style=shape.labelup, location=location.belowbar, color=color.green, text="Buy", title="Call Signal Marker")
plotshape(series=putSignal, style=shape.labeldown, location=location.abovebar, color=color.red, text="Sell", title="Put Signal Marker")