G 채널 지표와 결합된 동적 트렌드 모멘텀 최적화 전략

1
Follow
1781
Followers
개요
이 전략은 G채널, RSI 및 MACD 지표가 결합된 고급 트렌드 추적 거래 시스템입니다. 동적으로 지원 및 저항 영역을 계산하여 동력 지표와 결합하여 높은 확률의 거래 기회를 식별합니다. 전략의 핵심은 사용자 정의 된 G채널 지표를 사용하여 시장 추세를 확인하고 RSI와 MACD를 사용하여 동력 변화를 확인하여 더 정확한 거래 신호를 생성하는 것입니다.
전략 원칙
전략은 트레이딩 신호의 신뢰성을 보장하기 위해 3가지의 필터링 메커니즘을 사용한다. 첫째, G 채널은 지정된 주기 내의 최고 및 최저 가격을 계산하여 지지부진과 저항 영역을 동적으로 구성한다. 두 번째, RSI 지표는 시장이 과매 또는 과매매 상태인지 확인하는 데 사용되며, 더 가치있는 거래 기회를 필라하는 데 도움이 된다. 마지막으로, MACD 지표는 기둥 그래프의 긍정적 인 마이너스를 통해 동력의 방향과 강도를 확인한다.
전략적 이점
- 다차원 신호 확인 메커니즘은 거래의 정확성을 크게 향상시킵니다.
- 동적 스톱로스 및 수익 설정, 효과적인 위험 관리
- G 채널의 적응성 특성으로 인해 전략이 다른 시장 환경에 적응할 수 있습니다.
- 포지션 관리와 자금 관리를 포함한 철저한 위험 관리 시스템
- 시각적 태그 시스템은 거래 신호를 직관적으로 표시하여 분석 및 최적화를 용이하게 합니다.
전략적 위험
- 위기 시장에서 잘못된 신호가 발생할 수 있으며, 시장 환경을 식별해야 합니다.
- 매개 변수를 지나치게 최적화하면 과다 적합성의 위험이 발생할 수 있습니다.
- 다중 지표는 높은 변동의 기간에 지연 효과를 가질 수 있습니다.
- 부적절한 스톱 리스치 설정으로 인해 과도한 회수
전략 최적화 방향
- 시장 환경 인식 모듈을 도입하여 다른 시장 상태에서 다른 파라미터 설정을 사용합니다.
- 시장의 변동성에 따라 역동적으로 스톱 지점을 조정할 수 있는 적응형 스톱 메커니즘을 개발
- 거래량 분석 지표를 추가하여 신호의 신뢰성을 향상시킵니다.
- G 채널의 계산 방법을 최적화하여 지연 효과를 줄입니다.
요약하다
이 전략은 여러 가지 기술 지표를 통합하여 전체적인 거래 시스템을 구축합니다. 핵심 장점은 다차원 신호 확인 장치와 완벽한 위험 관리 시스템입니다. 지속적인 최적화 및 개선으로 전략은 다양한 시장 환경에서 안정적인 성능을 유지할 수 있습니다. 거래자는 실제 거래 전에 다양한 파라미터 조합을 충분히 테스트하고 특정 시장 특성에 따라 적절하게 조정하는 것이 좋습니다.
Source
Pine
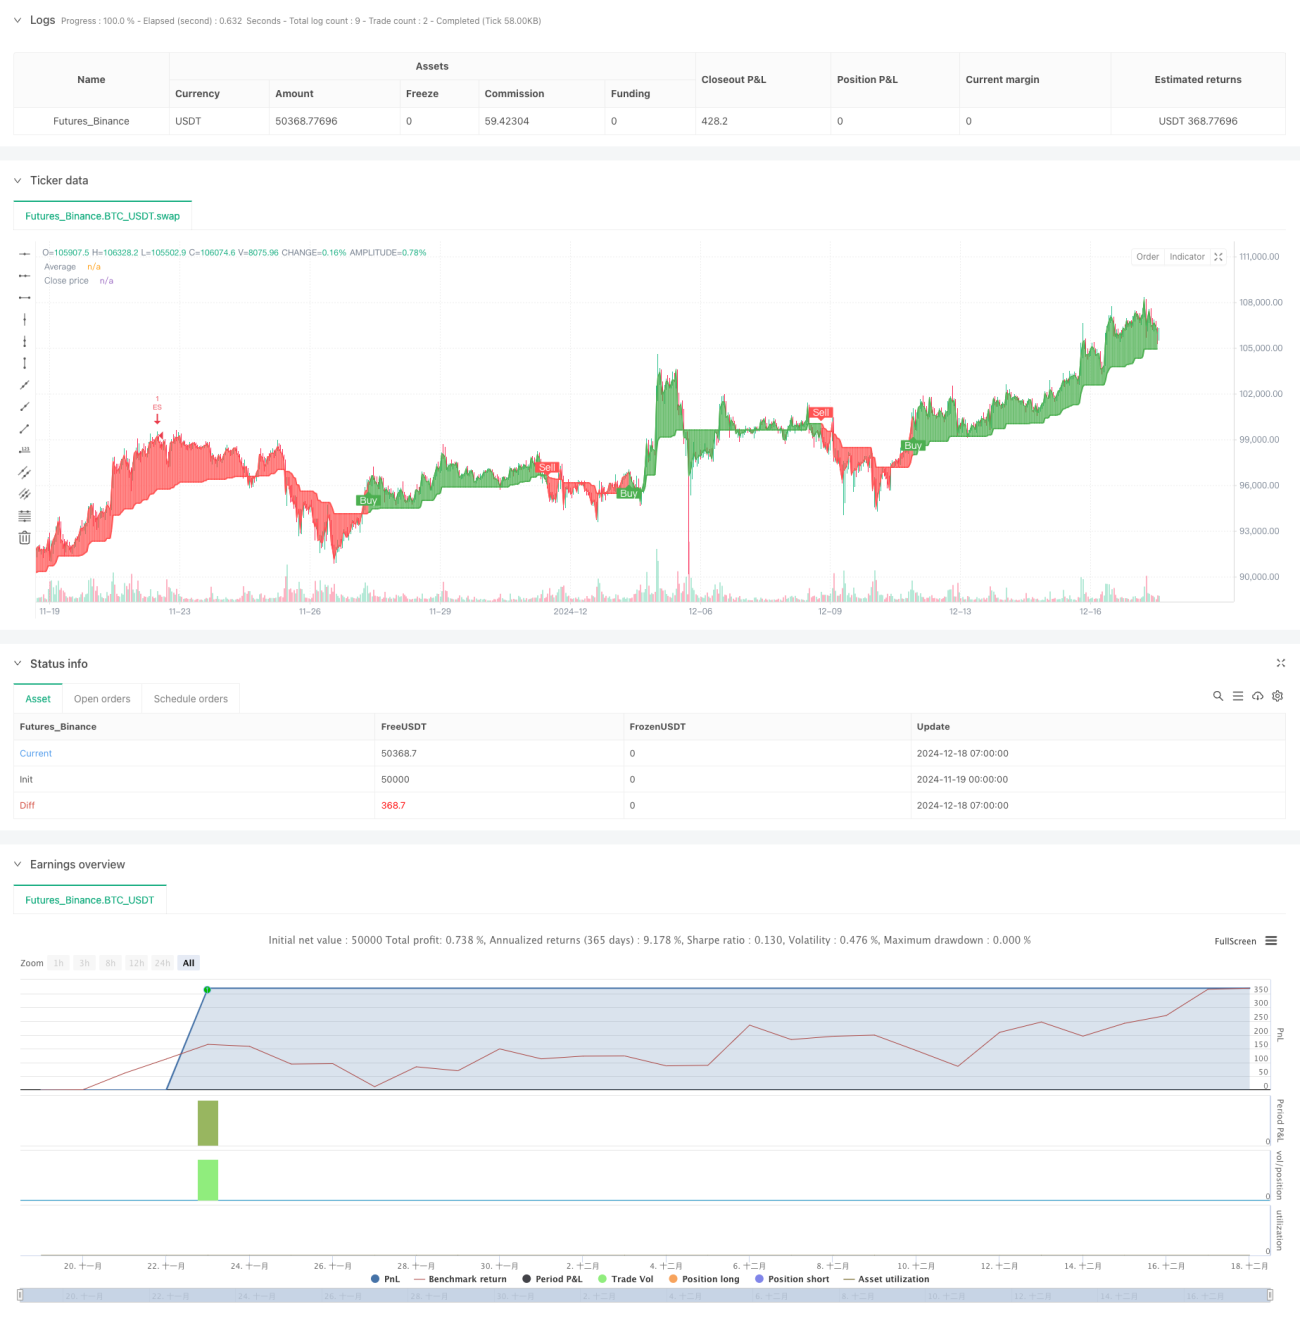
/*backtest
start: 2024-11-19 00:00:00
end: 2024-12-18 08:00:00
period: 1h
basePeriod: 1h
exchanges: [{"eid":"Futures_Binance","currency":"BTC_USDT"}]
*/

//@version=6
strategy("VinSpace Optimized Strategy", shorttitle="VinSpace Magic", overlay=true, default_qty_type=strategy.percent_of_equity, default_qty_value=10)

// Input ParametersStrategy parameters
Related strategies
Comment
All comments (0)
No data
- 1