개요
이 전략은 14주기 지수 이동 평균 ((EMA) 에 기반한 거래 시스템으로, 그래프 형태 분석과 가격 동력 특성을 결합한다. 이 전략은 가격과 EMA의 교차 관계를 분석하면서, 그래프의 형태 특성을 고려하면서 (예: 실체와 그림자 비율과 같은) 거래 신호를 결정하여 시장 추세의 변화점을 포착한다.
전략 원칙
전략의 핵심 논리는 다음과 같은 핵심 요소에 기초합니다.
- EMA 브레이크 확인: 14주기 EMA를 동적 지원 및 저항 지점으로 사용한다.
- 그라피즘 분석:
- 구매 조건은 양이 양선으로 되어 있다 (폐쇄가격이 개시가격보다 높다)
- 판매 조건은 이 될 필요가 있다. (폐쇄 가격은 오픈 가격보다 낮다.)
- 가격 관통 검증:
- 구매시 최소 50%의 탄소 실체가 EMA를 통과해야 합니다.
- 판매할 때 가격이 완전히 EMA를 넘어설 필요가 있습니다.
- 그림선 비율 제어:
- 구매 신호는 상하 그림자 선의 총 길이가 전체 선의 40%를 넘지 않도록 요구합니다.
- 신호 제한 아래 그림자 선의 전체 길이의 20%를 넘지 않는 판매
전략적 이점
- 엄격한 신호 품질 제어: 여러 조건 검증으로 가짜 침입 위험을 효과적으로 감소시킵니다.
- 형태 인식 정확: 개체와 그림선 비율 분석을 결합하여 신호 신뢰성을 향상
- 트렌드 추적 능력: EMA의 동적 특성을 활용하여 시장의 흐름을 효과적으로 추적할 수 있습니다.
- 리스크 제어: 엄격한 그림자 비율 제어로 거래 위험을 낮추는
- 잘 적응: 전략의 매개 변수는 시장 조건에 따라 유연하게 조정됩니다.
전략적 위험
- 수평 시장 위험: 불안한 시장에서 빈번한 잘못된 신호가 발생할 수 있습니다.
- 지연 위험: EMA 지표 자체는 지연성이 있으며, 최적의 진입 지점을 놓칠 수 있습니다.
- 위험: 큰 폭으로 뛰어내려서 손해배상 효과가 떨어질 수 있다.
- 매개 변수 민감성: 전략의 유효성을 유지하기 위해 다른 시장 환경에서 매개 변수를 조정해야 할 수 있습니다.
전략 최적화 방향
- 이 문서는 “일반적으로”라고 부릅니다.
- 시장의 변동성을 평가하는 ATR 지표가 추가되었습니다.
- 높은 파동 동안 신호 확인 문턱을 높여
- 다중 주기 검증:
- 더 많은 시간 주기를 추가하는 추세 확인
- 다주기 신호 일치성 검증 메커니즘 구축
- 동적 매개변수 최적화:
- 시장의 변동에 따라 EMA 주기를 동적으로 조정합니다.
- 자율적으로 그림자 비율을 조정할 수 있습니다.
- 포지션 관리 최적화:
- 시장의 변동성을 기반으로 설계된 동적 포지션 시스템
- 피라미드 상장제도 도입
요약하다
이 전략은 EMA, 그래프 형태 및 가격 행동 분석을 종합적으로 적용하여 전체적인 거래 시스템을 구축한다. 전략의 장점은 신호 확인의 엄격성과 위험 제어의 완벽함에 있다. 그러나 또한 전략의 성능에 대한 시장 환경의 영향을 고려해야 한다. 제안된 최적화 방향에 의해 전략의 안정성과 적응성이 더욱 향상될 전망이다.
전략 소스 코드
/*backtest
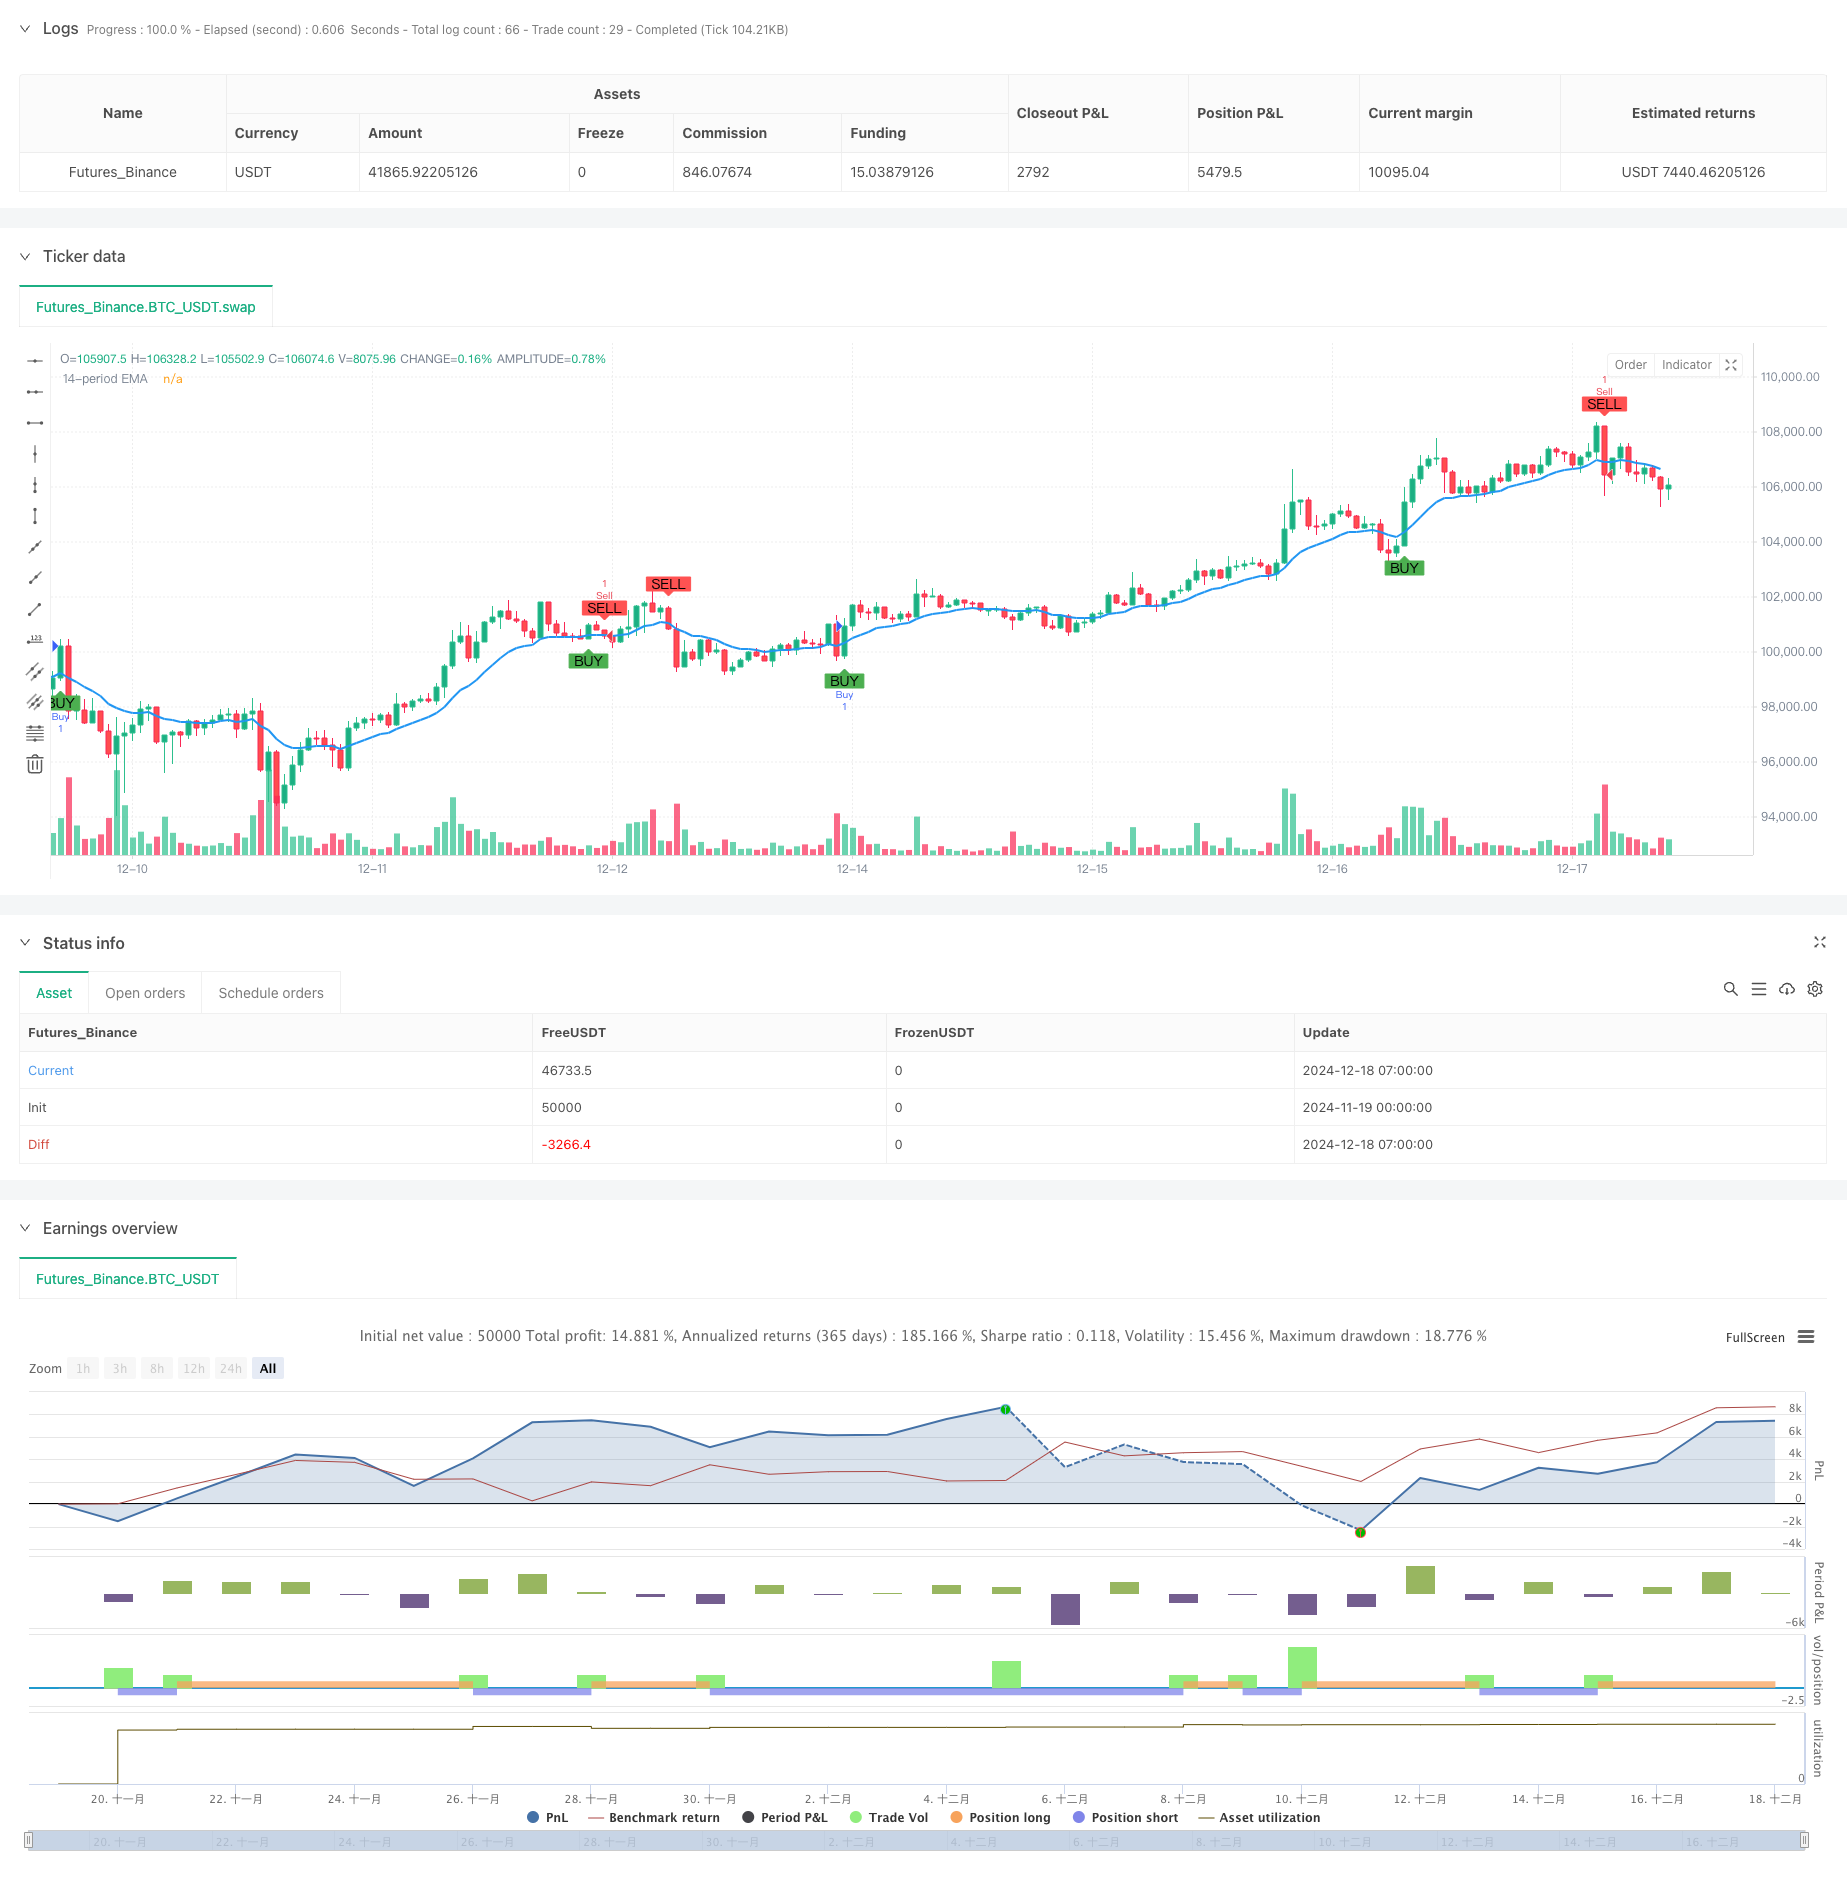
start: 2024-11-19 00:00:00
end: 2024-12-18 08:00:00
period: 1h
basePeriod: 1h
exchanges: [{"eid":"Futures_Binance","currency":"BTC_USDT"}]
*/
//@version=6
strategy("Buy and Sell Signals with EMA", overlay=true)
// Define the 14-period EMA
ema14 = ta.ema(close, 14)
// --- Buy Conditions ---
ema_length = input.int(14, title="EMA Length")
// Calculate the 14 EMA
ema_14 = ta.ema(close, ema_length)
// Calculate the candle body and wicks
body = close - open
upper_wick = high - close
lower_wick = open - low
total_candle_length = high - low
// Define the condition for the candle to be green (bullish)
is_green_candle = close > open
// Condition for crossing the 14 EMA (previous close was below, current close is above)
crossing_ema = ta.crossover(close, ema_14)
// Condition for at least 50% of the candle's body crossing the 14 EMA
body_crossed_ema = (close - open) * 0.5 <= (close - ema_14) and close > ema_14
// Condition for wick percent being less than or equal to 40% of the total candle length
wick_percent = (upper_wick + lower_wick) / total_candle_length
valid_wick_condition = wick_percent <= 0.4
// Define the buy condition
buy_condition = is_green_candle and crossing_ema and body_crossed_ema and valid_wick_condition
// --- Sell Conditions ---
candleIsRed = close < open
priceBelowEMA = close < ema14
prevLowAboveEMA = low[1] > ema14[1] // Previous candle's low must be above the EMA
wickTooLarge = (low - math.min(open, close)) / (high - low) <= 0.2 // Lower wick should not exceed 20%
// Sell signal condition
sellSignal = priceBelowEMA and candleIsRed and prevLowAboveEMA and wickTooLarge
// --- Plotting ---
plot(ema14, color=color.blue, linewidth=2, title="14-period EMA") // Plot the 14-period EMA
// Plot the buy signal as an arrow on the chart
plotshape(buy_condition, color=color.green, style=shape.labelup, location=location.belowbar, text="BUY")
// Plot the sell signal as an arrow on the chart
plotshape(sellSignal, location=location.abovebar, color=color.red, style=shape.labeldown, title="Sell Signal", text="SELL")
// Optional: Add strategies for backtesting
if (buy_condition)
strategy.entry("Buy", strategy.long)
if (sellSignal)
strategy.entry("Sell", strategy.short)