
1
Follow
1781
Followers
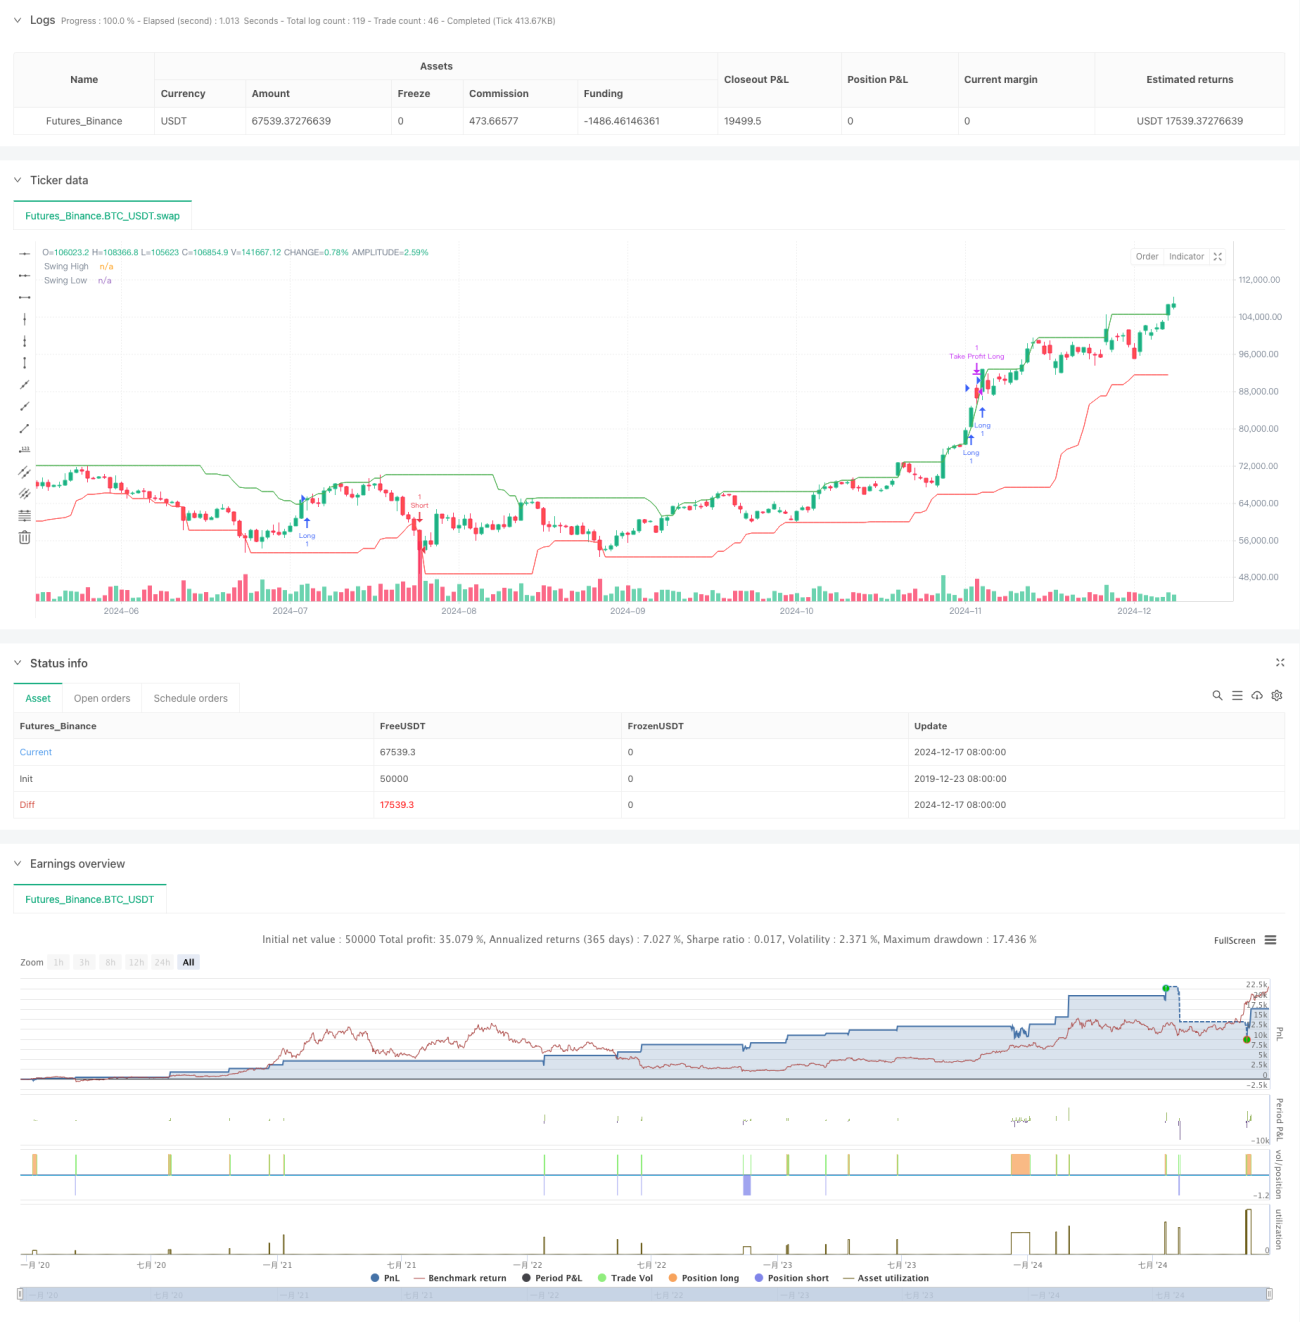
개요
이 전략은 거래의 신뢰성과 위험 제어 능력을 높이기 위해 연속적인 확인 횟수 요구 사항과 동적 스톱 로스 설정을 포함한 다중 조건 검증 메커니즘을 사용합니다.
전략 원칙
전략의 핵심 논리에는 다음과 같은 핵심 요소가 포함됩니다.
- 지정된 주기 내의 최고 가격과 최저 가격을 계산하여 구조적인 최고점과 최저점을 식별합니다.
- 이동 평균을 사용하여 거래량 기준을 계산하여 현재 거래량이 크게 증가했는지 판단합니다.
- 가격이 이전 고점을 넘어서 거래량이 증가하면 누적된 다중 확인
- 가격 하락과 거래량이 증가할 때 누적 공백 확인
- 거래 신호는 지정된 확인 횟수를 달성한 후에만 트레이드 신호를 <unk>니다.
- 창고가 된 후 백분율 기반의 스톱 스톱 가격
전략적 이점
- 다중 조건 검증 메커니즘이 거래 신호의 신뢰성을 높인다.
- 가짜 돌파구로 인한 잘못된 판단을 방지하기 위해 합성 거래량 지표
- 연속 확인 메커니즘을 사용하여, 동작 주파수를 낮추고, 승률을 높여라
- 다이내믹 스톱 스톱 손실 설정으로, 진입 가격에 따라 퇴출 위치를 자동으로 조정
- 명확한 전략 논리, 변수 조정성, 적응성
전략적 위험
- 파동 시장은 종종 가짜 돌파구가 발생하여 연속적인 손실을 초래할 수 있습니다.
- 이 경우, 주식 시장의 변동이 심할 경우, 스톱 파일이 적절하지 않을 수 있습니다.
- 확인 메커니즘으로 인해 입장이 지연되고, 최고의 가격을 놓칠 수 있습니다.
- 거래량 판단 기준이 고정되어 있어 시장의 변화에 잘 적응할 수 없다.
해결책:
- 시장 변동률 지표, 동적 조정 매개 변수 도입
- 트렌드 필터를 추가하여 위축 시장의 가짜 신호를 줄여줍니다.
- 손해 차단 논리를 최적화하고 손해 차단 유연성을 향상시킵니다.
- 맞춤형 교역량 <unk>값 계산 방법을 설계
전략 최적화 방향
- 이동 평균 시스템과 같은 추세를 판단하는 지표를 추가하여 추세 방향으로만 거래합니다.
- ATR 지표의 동적으로 조정되는 정지 거리를 도입하여 풍력 제어의 유연성을 향상시킵니다.
- 설계 변동률 자율적 거래량 하락 판단 메커니즘
- 시간 필터를 추가하여 위험 기간을 피하십시오.
- 인증 메커니즘을 최적화하여 신뢰성을 보장하면서 입학 시 효율성을 높입니다.
요약하다
이것은 기술분석의 고전 이론과 현대적인 양적 거래방법을 결합한 전략 시스템이다. 다중 조건 검증과 엄격한 위험 통제를 통해 전략은 더 나은 안정성과 신뢰성을 가지고 있다.
Source
Pine
Strategy parameters
Related strategies
Comment
All comments (0)
No data
- 1