
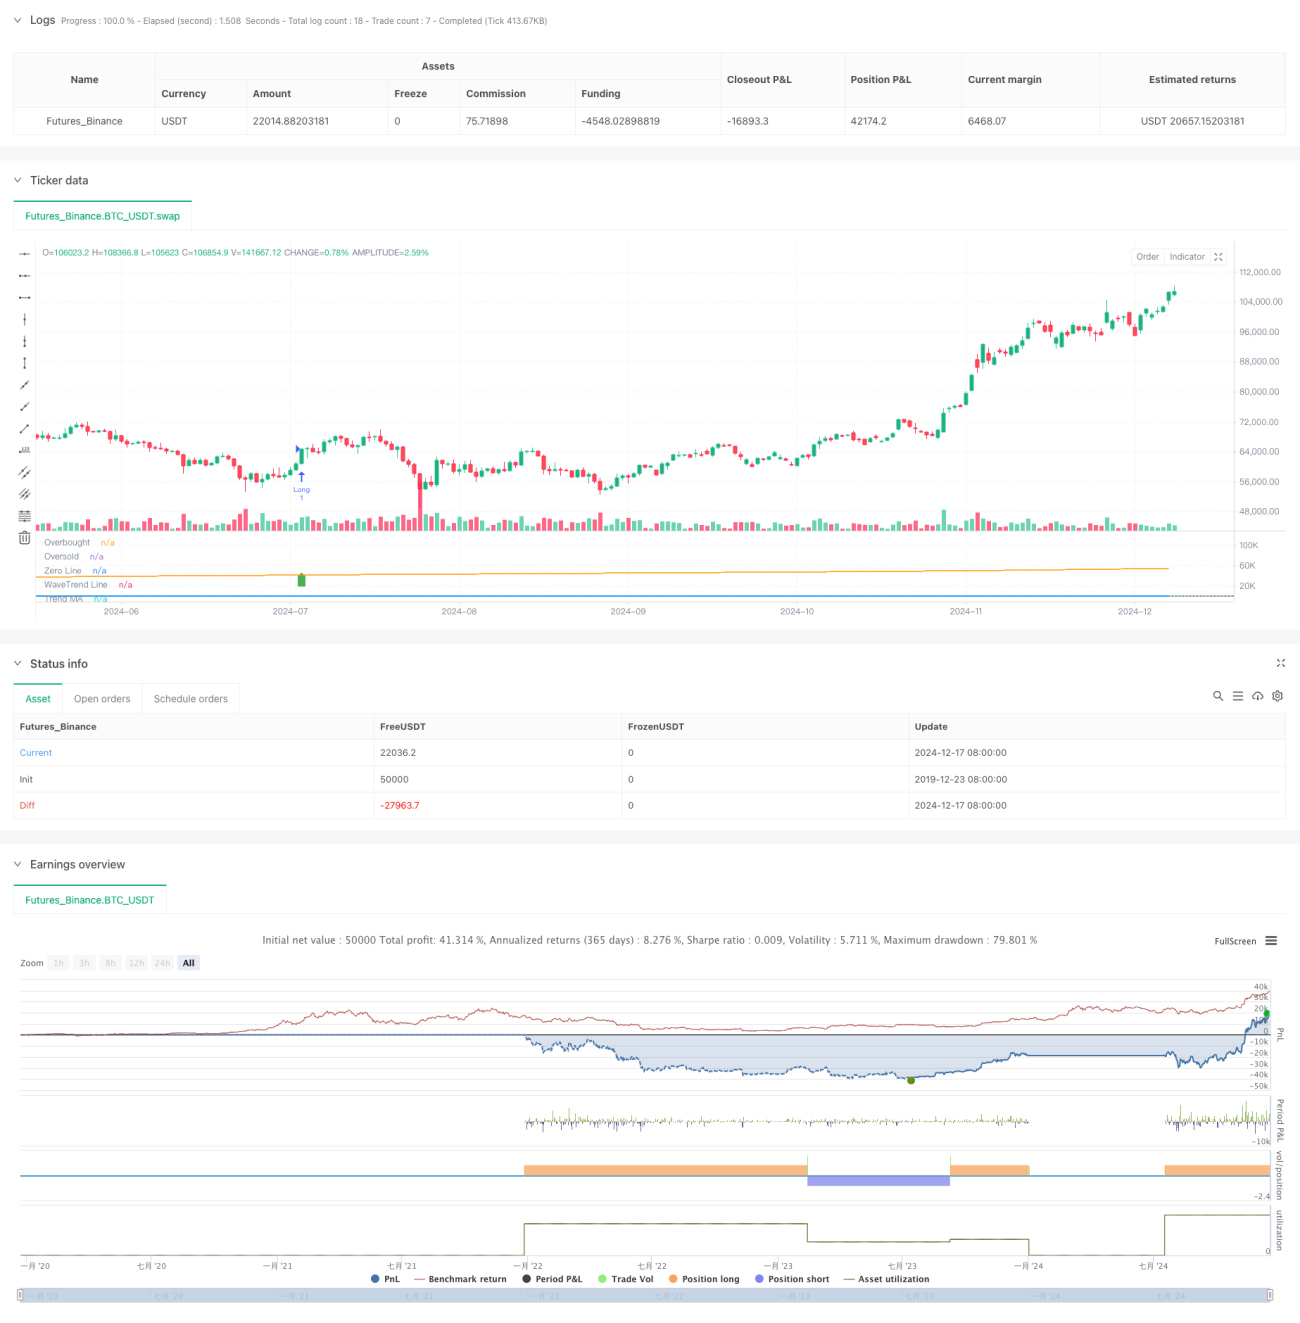
이 전략은 WaveTrend 지표와 트렌드 추적을 기반으로 한 정량화 거래 시스템이다. WaveTrend 지표와 이동 평균을 결합하여 완전한 거래 의사 결정 프레임워크를 형성한다. 전략은 EMA와 SMA를 사용하여 파동 트렌드 값과 시장 전체의 추세를 계산하고, 오버 바이 오버 소매 시점을 설정하여 시장 전환점을 식별하고, 트렌드 필터와 결합하여 거래의 정확성을 향상시킵니다.
이 전략의 핵심은 다음과 같은 단계로 이루어집니다.
이 전략은 WaveTrend 지표와 트렌드 필터를 능숙하게 결합하여 안정적인 거래 시스템을 구축합니다. 전략은 운영의 간결성을 유지하면서 시장에 대한 전체적인 분석을 수행합니다.
/*backtest
start: 2019-12-23 08:00:00
end: 2024-12-18 08:00:00
period: 1d
basePeriod: 1d
exchanges: [{"eid":"Futures_Binance","currency":"BTC_USDT"}]
*/
// This Pine Script™ code is subject to the terms of the Mozilla Public License 2.0 at https://mozilla.org/MPL/2.0/
// © mojomarv
//@version=6
strategy("WaveTrend with Trend Filter", shorttitle="WaveTrend Trend", overlay=false, initial_capital = 100000)
// Inputs for the WaveTrend indicator
inputLength = input.int(10, title="Channel Length", minval=1)
avgLength = input.int(21, title="Average Length", minval=1)
obLevel = input.float(45, title="Overbought Level")
osLevel = input.float(-45, title="Oversold Level")
showSignals = input.bool(true, title="Show Buy/Sell Signals")
// Trend filter input
maLength = input.int(500, title="Trend MA Length", minval=1)
// Calculate WaveTrend values
hlc_avg = (high + low + close) / 3 // Renamed from hlc3 to hlc_avg
esa = ta.ema(hlc_avg, inputLength)
d = ta.ema(math.abs(hlc_avg - esa), inputLength)
k = (hlc_avg - esa) / (0.015 * d)
ci = ta.ema(k, avgLength)
tci = ta.ema(ci, avgLength)
// Moving average for trend detection
trendMA = ta.sma(close, maLength)
// Determine trend
bullishTrend = close > trendMA
bearishTrend = close < trendMA
// Generate signals with trend filter
crossUp = ta.crossover(tci, osLevel)
crossDown = ta.crossunder(tci, obLevel)
// Plot WaveTrend
plot(tci, title="WaveTrend Line", color=color.new(color.blue, 0), linewidth=2)
hline(obLevel, "Overbought", color=color.red, linestyle=hline.style_dotted)
hline(osLevel, "Oversold", color=color.green, linestyle=hline.style_dotted)
hline(0, "Zero Line", color=color.gray, linestyle=hline.style_solid)
// Plot moving average for trend visualization
plot(trendMA, title="Trend MA", color=color.orange, linewidth=1)
// Plot buy and sell signals
plotshape(showSignals and crossUp, title="Buy Signal", location=location.belowbar, style=shape.labelup, color=color.new(color.green, 0), size=size.small)
plotshape(showSignals and crossDown, title="Sell Signal", location=location.abovebar, style=shape.labeldown, color=color.new(color.red, 0), size=size.small)
// Alerts
alertcondition(crossUp, title="Buy Alert", message="WaveTrend Buy Signal (Trend Confirmed)")
alertcondition(crossDown, title="Sell Alert", message="WaveTrend Sell Signal (Trend Confirmed)")
alertcondition(bullishTrend, title="bull", message="WaveTrend Sell Signal (Trend Confirmed)")
alertcondition(bearishTrend, title="bear", message="WaveTrend Sell Signal (Trend Confirmed)")
// Strategy logic
if crossUp and bullishTrend
strategy.entry("Long", strategy.long)
if crossDown
strategy.close("Long")
if crossDown and bearishTrend
strategy.entry("Short", strategy.short)
if crossUp
strategy.close("Short")