
1
Follow
1781
Followers
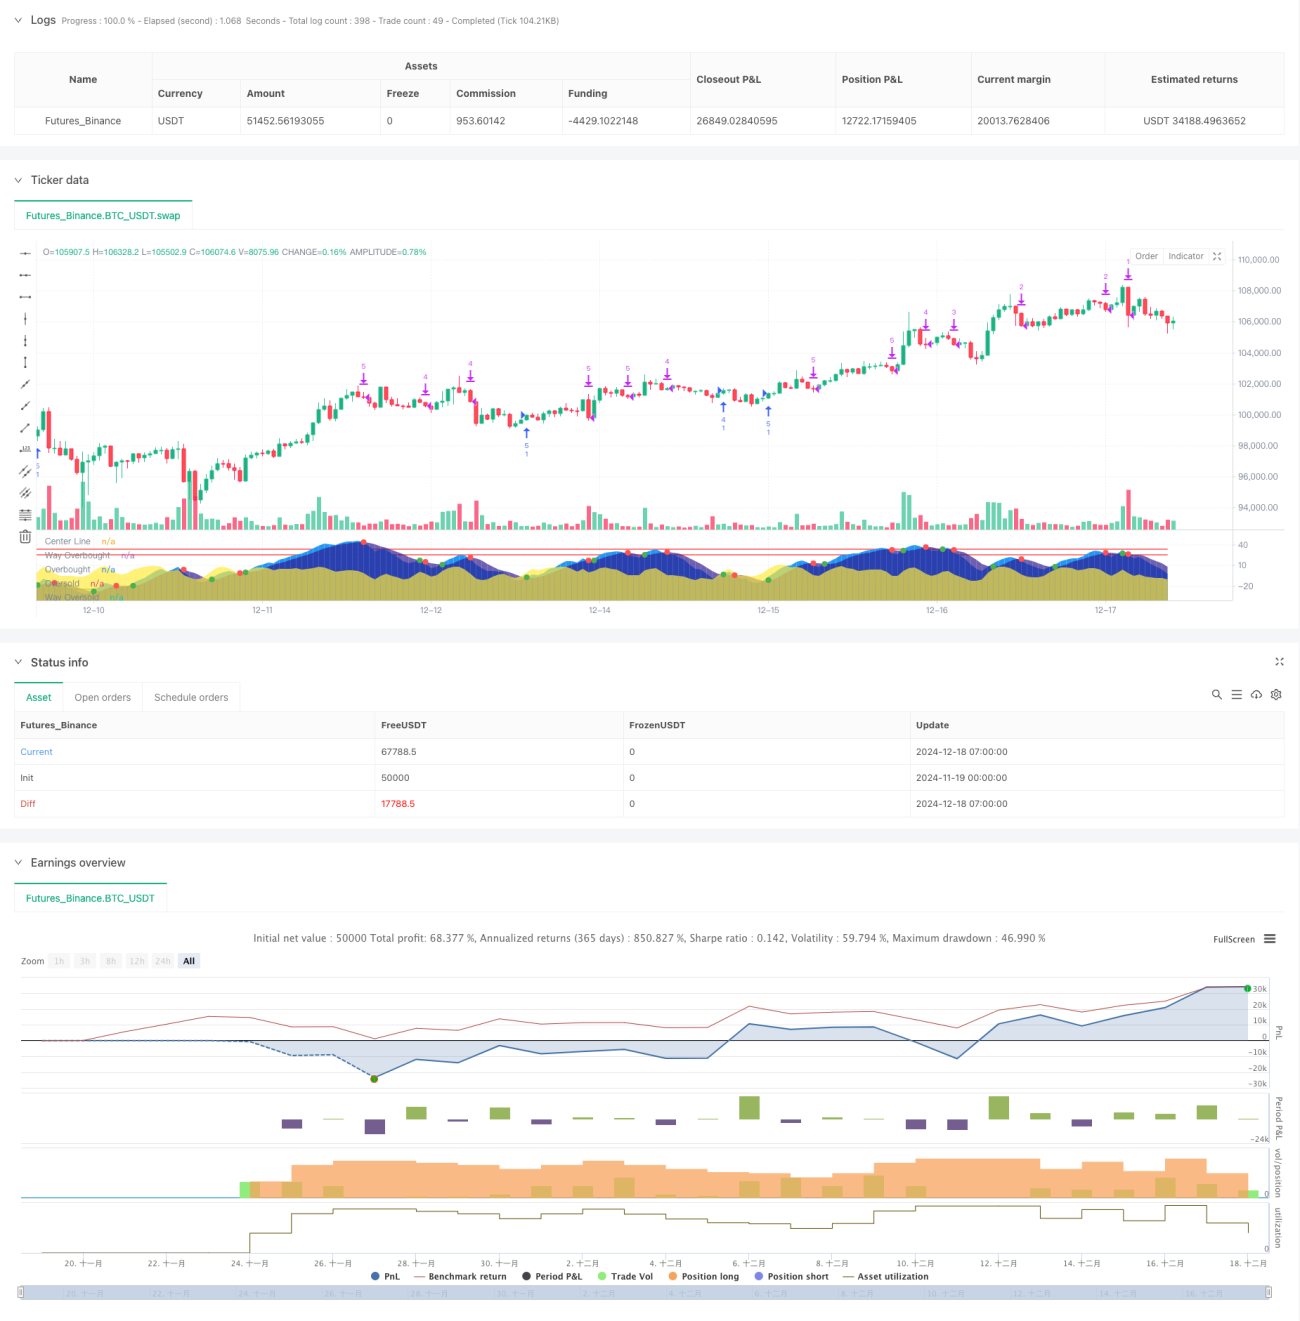
전략 개요
이 전략은 파동 동향 지표 ((Wave Trend) 와 분산 투자 ((Dollar Cost Averaging) 의 개념에 기반한 지능형 거래 시스템이다. 전략은 시장의 변동 동향을 분석하여 시장이 초매 지역에있는 동안 단계적으로 포지션을 구축하고, 시장이 불시장이 확인되는 경우 단계적으로 수익을 얻습니다. 이 전략은 기술 분석과 위험 관리의 장점을 결합하여 시장 주기에 걸쳐 지속적으로 포지션을 축적하고 수익을 얻을 수 있습니다.
전략 원칙
전략의 핵심 논리에는 다음과 같은 핵심 요소가 포함됩니다.
- HLC3 가격 평균과 지수 이동 평균 (EMA) 을 사용하여 파동 경향 지표를 계산하여 시장의 과매매 상태를 식별합니다.
- 마법의 진동기 (Awesome Oscillator) 를 통해 대주기 트렌드를 판단하고, 황소와 곰 시장의 상태를 결정합니다.
- 곰 시장 기간 동안, 가격이 초매 지역에 있을 때, 매장 비율이 초매 정도에 따라 동적으로 조정
- 황소 시장이 시작될 때, 시스템은 "황금을 사"라는 신호를 내보냅니다.
- 황소 시장 기간 동안, 가격이 과매매 영역에 들어갔을 때, 시스템은 과매매 정도에 따라 점진적으로 지분 수익을 감소시킵니다.
- 하파 신호나 상위 시점이 발생하면, 시스템은 모든 포지션을 비워서 수익을 고정합니다.
전략적 이점
- 분산 투자로 창고 건설 비용을 절감하고 재고 위험을 효과적으로 회피합니다.
- 여러 기술 지표가 교차 검증되어 거래 신호의 신뢰성이 향상됩니다.
- 포지션 관리가 유연하며, 시장 상황에 따라 거래량을 조정합니다.
- 강인한 방어 성질로, 곰 시장 신호가 발생했을 때 적시에 손실을 막는
- 명확한 전략 논리, 다양한 시장 환경에 적응할 수 있는 변수
전략적 위험
- 거래가 빈번하게 이루어질 수 있고, 거래비용이 증가할 수 있습니다.
- 분산 포지션 전략은 일방적인 급격한 상승 시점에 최적의 매수점을 놓칠 수 있습니다.
- 기술적인 지표는 시장의 급격한 변동에 반응하지 않을 수 있습니다.
- 잘못된 매개 변수 설정으로 인해 매장 또는 매장 감소 시기가 정확하지 않을 수 있습니다.
전략 최적화 방향
- 변동률 지표 도입, 포지션 구축 및 해제 수를 최적화
- 트렌드 판단의 정확성을 높이기 위해 더 많은 시장 정서 지표를 추가합니다.
- 다양한 시장 주기적 역동성에 따라 변수를 조정하는 적응 변수 시스템을 개발
- 재원 관리 모듈을 추가하여 보다 세밀한 포지션 제어
요약하다
이것은 기술 분석과 위험 관리를 유기적으로 결합한 지능형 거래 전략입니다. 파동 추세 지표와 분산 투자 방법을 통해 자금을 안전하게 보호하면서 안정적인 수익 성장을 달성합니다. 전략의 핵심 장점은 다양한 시장 환경에 대한 적응력과 명확한 거래 논리와 위험 제어 장치입니다.
Source
Pine
Strategy parameters
Related strategies
Comment
All comments (0)
No data
- 1