다중 기술 지표 교차 추세 추적 전략: RSI 및 확률적 RSI 협력 거래 시스템

1
Follow
1781
Followers
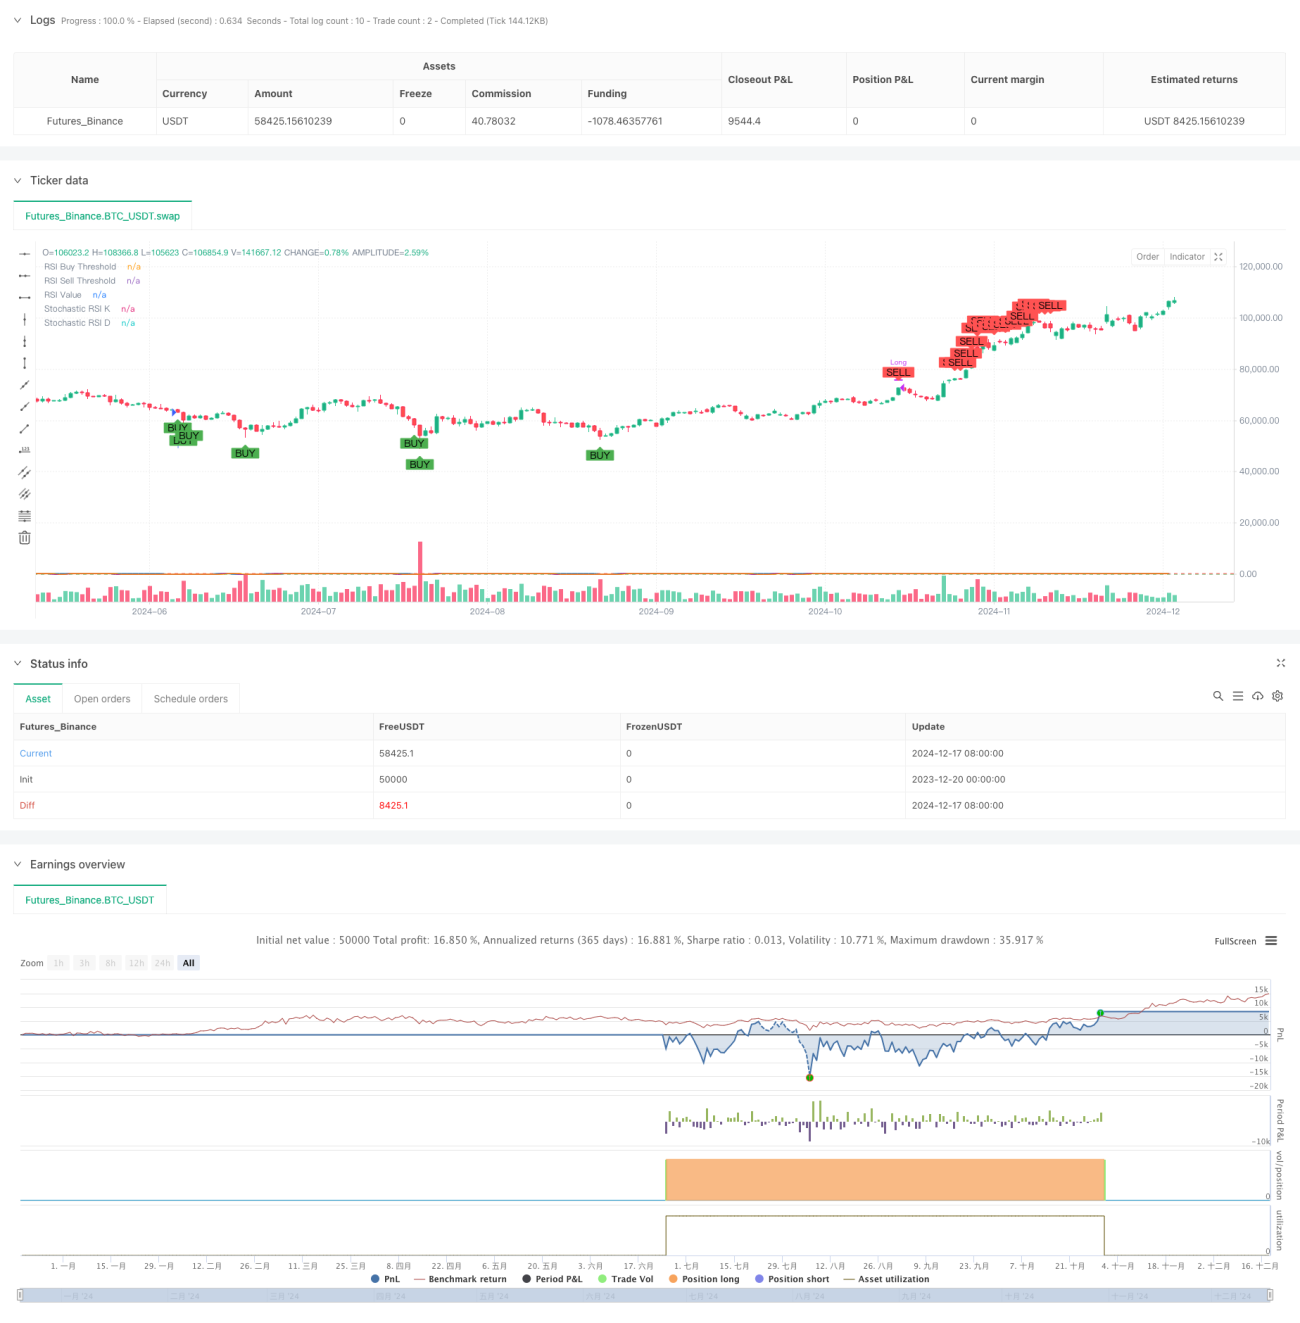
개요
이 전략은 상대적으로 약한 지표 ((RSI) 와 임의의 상대적으로 강한 지표 ((Stochastic RSI) 에 기반한 트렌드 추적 거래 시스템이다. 이 전략은 RSI와 스토카스틱 RSI의 오버 바이 오버 시드 수준을 모니터링하여 시장에서 오버 바이 또는 오버 시드 신호가 발생하면 거래한다. 이 전략은 일선과 주선 시간 주기에서 작동하는 것을 지원하여 거래자에게 유연한 거래 옵션을 제공합니다.
전략 원칙
전략은 주로 두 가지 기술 지표에 기반합니다: RSI와 스토카스틱 RSI. RSI는 가격 변화의 속도와 폭을 측정하는 데 사용되며, 스토카스틱 RSI는 RSI 값에 대한 무작위 지표 계산을 통해 더 민감한 시장 오버 바이 오버 세일 신호를 제공합니다. 구매 신호는 RSI가 35보다 낮고 스토카스틱 RSI의 K 값이 20보다 낮으면 시장이 오버 세일 상태임을 나타냅니다.
전략적 이점
- 이중 확인 메커니즘: RSI와 Stochastic RSI를 결합하여 거짓 신호의 영향을 줄인다.
- 유연한 시간 사이클: 일선 및 주경 시간 사이클에서 작동하는 것을 지원하고, 다른 거래 스타일에 적응한다.
- 매개 변수 조정: 거래자는 시장 상황에 따라 RSI와 Stochastic RSI의 매개 변수를 조정할 수 있습니다.
- 시각화 효과: 전략은 명확한 구매 및 판매 신호 표시와 지표 라인의 시각적 표시를 제공합니다.
- 체계적: 전략 논리가 명확하고 출전 및 출전 규칙이 명확하다.
전략적 위험
- 흔들림 시장 위험: 가로판 흔들림 시장에서 거래 신호가 자주 발생하여 거래 비용이 증가할 수 있습니다.
- 트렌드 반전 위험: 강한 트렌드 시장에서, 전략은 오버 바이 오버 셀 신호로 인해 조기 평준화하여 큰 상황을 놓칠 수 있습니다.
- 매개 변수 감수성: 다른 매개 변수 설정으로 인해 거래 결과가 크게 달라질 수 있습니다.
- 뒤떨어진 위험: 기술 지표는 본질적으로 뒤떨어진 성격을 지니고 있으며, 출전 및 출전 시기가 약간 늦어질 수 있다.
전략 최적화 방향
- 트렌드 필터 도입: 이동 평균과 같은 트렌드 지표를 추가하여 트렌드가 명확한 경우에만 거래 신호를 실행할 수 있습니다.
- 최적화 매개 변수 자조: 시장의 변동성에 따라 매개 변수가 자동으로 조정될 수 있도록 동적 매개 변수 조정 메커니즘을 개발한다.
- 손해 제도를 높여라: ATR 또는 고정 비율에 기반한 손해 조건을 설정하고, 위험을 통제한다.
- 트랜지먼트 확인을 추가: 트랜지먼트 지표를 결합하여 신호의 신뢰성을 높인다.
- 신호 강도 평가를 개발: 신호 강도 평점 시스템을 구축하고, 다른 신호 강도에 따라 포지션 크기를 조정한다.
요약하다
이 전략은 RSI와 Stochastic RSI의 장점을 결합하여 비교적 신뢰할 수있는 거래 시스템을 구축합니다. 제한이 있지만, 합리적인 위험 관리와 지속적인 최적화를 통해 전략은 좋은 실용적 가치를 가지고 있습니다. 거래자는 실제 사용 전에 다양한 변수 조합을 충분히 테스트하고 시장 환경과 개인 위험 선호도에 따라 적절하게 조정하는 것이 좋습니다.
Source
Pine
Strategy parameters
Related strategies
Comment
All comments (0)
No data
- 1