
1
Follow
1781
Followers
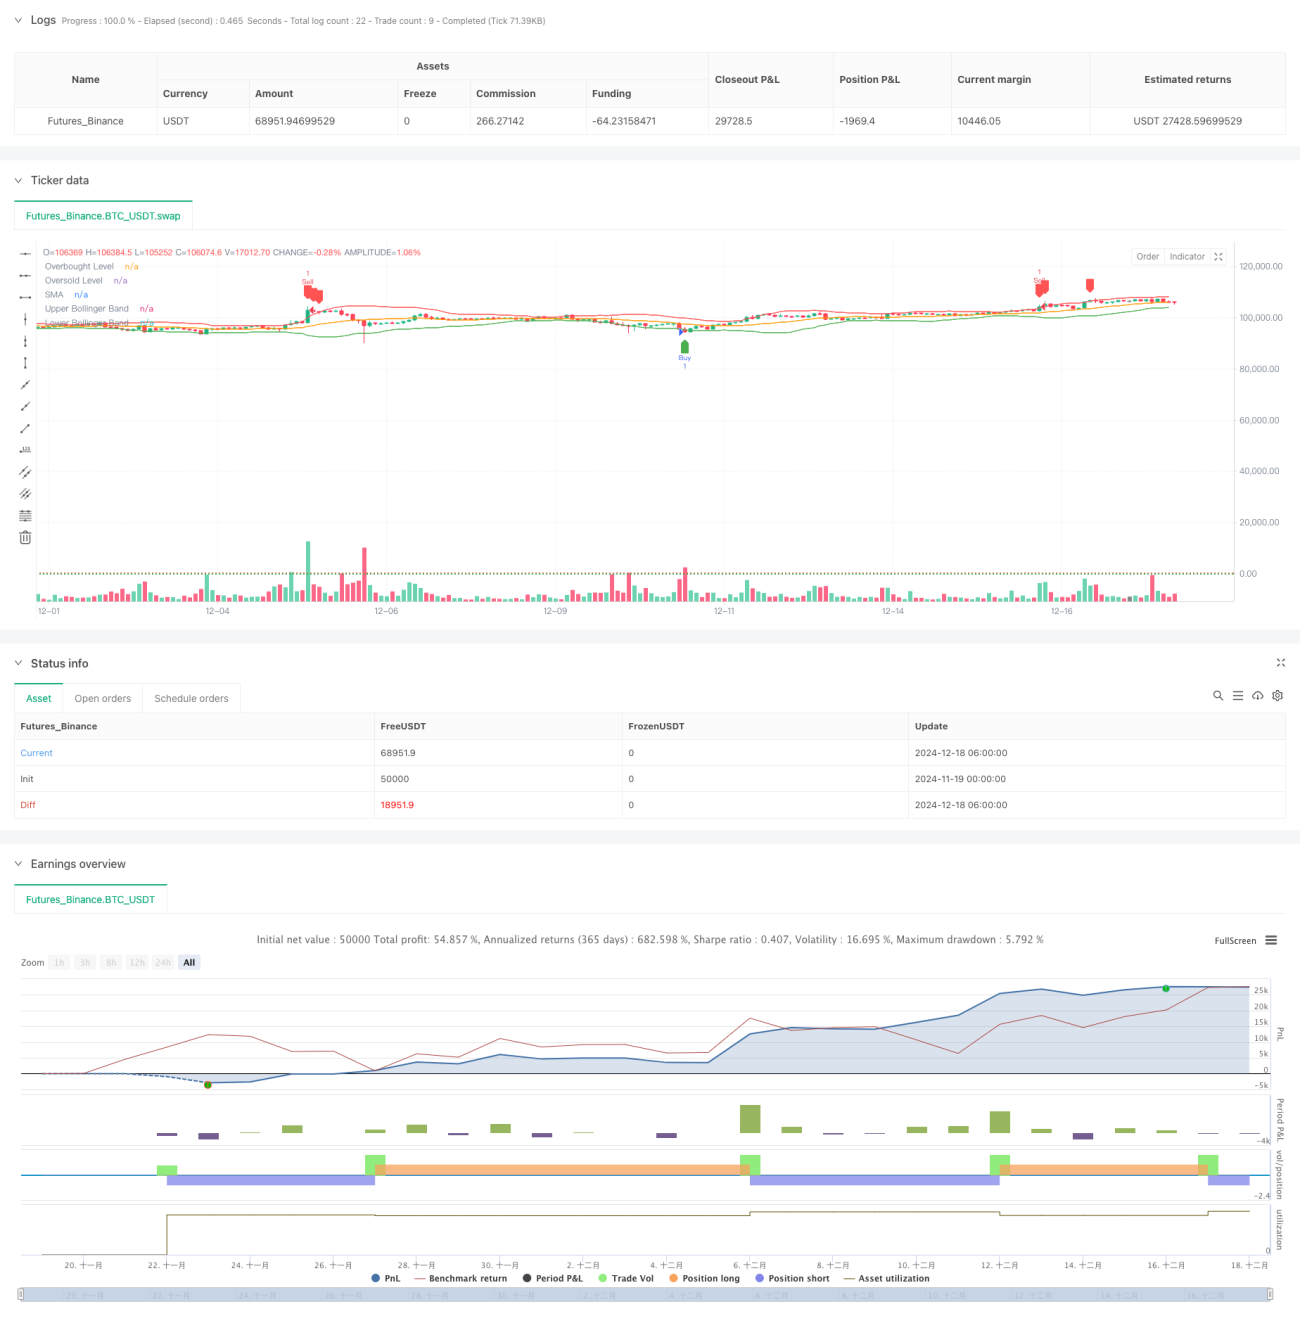
개요
이 전략은 부린 밴드 (Bollinger Bands) 와 상대적으로 약한 지표 (RSI) 를 결합한 평균 회귀 거래 시스템이다. 이 전략은 가격의 평균에서 벗어난 극단적인 상황을 식별하고 RSI 오버 바이 오버 세 신호와 결합하여 거래 시기를 결정한다. 가격이 부린 밴드를 돌파하고 RSI가 오버 세 영역에있을 때 더 많은 신호를 생성하고, 가격이 부린 밴드를 돌파하고 RSI가 오버 바이 영역에있을 때 빈 신호를 생성한다.
전략 원칙
전략의 핵심 논리는 금융 시장의 평균 회귀 특성에 기반한다. 구체적으로 구현할 때, 20일 간소 이동 평균 ((SMA) 을 평균 참조로 사용하고, 표준 차이의 곱이 2.0로 부린 대역폭을 계산한다. 14일 RSI를 보조 지표로 도입하고, 70과 30을 초과 구매 초과 판매 시점으로 설정한다. 전략은 가격이 부린 대역을 뚫고 RSI가 극한에 도달했을 때 거래 신호를 유발한다. 이 쌍 확인 메커니즘은 전략의 신뢰성을 높인다.
전략적 이점
- 다중 기술 지표와 결합하여 더 신뢰할 수 있는 거래 신호를 제공합니다.
- RSI와 브린 띠를 통해 가짜 돌파구를 효과적으로 필터링합니다.
- 매개변수는 다양한 시장 환경에 적응하도록 매우 조정 가능합니다.
- 명확하고 이해하기 쉽고 실행하기 쉬운 전략 논리
- 잘 작동하는 위험 제어 장치
- 코드는 간결하고 효율적이며, 유지보수 및 최적화를 용이하게 합니다.
전략적 위험
- 유동시장에서 빈번하게 조세상태가 발생하여 수익에 영향을 미칠 수 있다.
- 잘못 선택된 매개 변수는 신호 지연을 유발할 수 있습니다.
- 시장의 급격한 변동으로 인해 더 큰 회수일 수 있다.
- 거래 비용이 전략 수익에 미치는 영향을 고려해야 합니다.
- 다양한 시장 환경에서의 전략 성과에 큰 차이가 있습니다.
전략 최적화 방향
- 시장의 변동성에 따라 조정되는 적응형 브린 대역폭을 도입합니다.
- 트렌드 필터를 추가하여 강세를 보이는 시장에서 거래 빈도를 낮추는 것
- RSI 파라미터를 최적화하여 적응 주기를 고려하십시오.
- 위험과 이익의 비율을 높이기 위해 손해배상 제약을 추가합니다.
- 신호 신뢰성을 높이기 위해 교통량 지표를 도입하는 것을 고려하라
- 매개 변수 최적화 모듈을 개발하여 전략을 자동 조정합니다.
요약하다
이 전략은 브린 띠와 RSI의 연동 작용을 통해 안정적인 평균 회귀 거래 시스템을 구축한다. 전략 설계는 합리적이며, 좋은 확장성과 적응성을 가지고 있다. 지속적인 최적화와 개선을 통해 전략의 안정성과 수익성을 더욱 향상시킬 수 있다. 실물 거래 전에 충분한 피드백 검증을 수행하고 특정 시장 특성에 따라 파라미터 설정을 조정하는 것이 좋습니다.
Source
Pine
Strategy parameters
Related strategies
Comment
All comments (0)
No data
- 1