ATR 동적 위험 제어를 기반으로 한 다중 이동 평균 협력 추세 변동 거래 전략

1
Follow
1785
Followers
개요
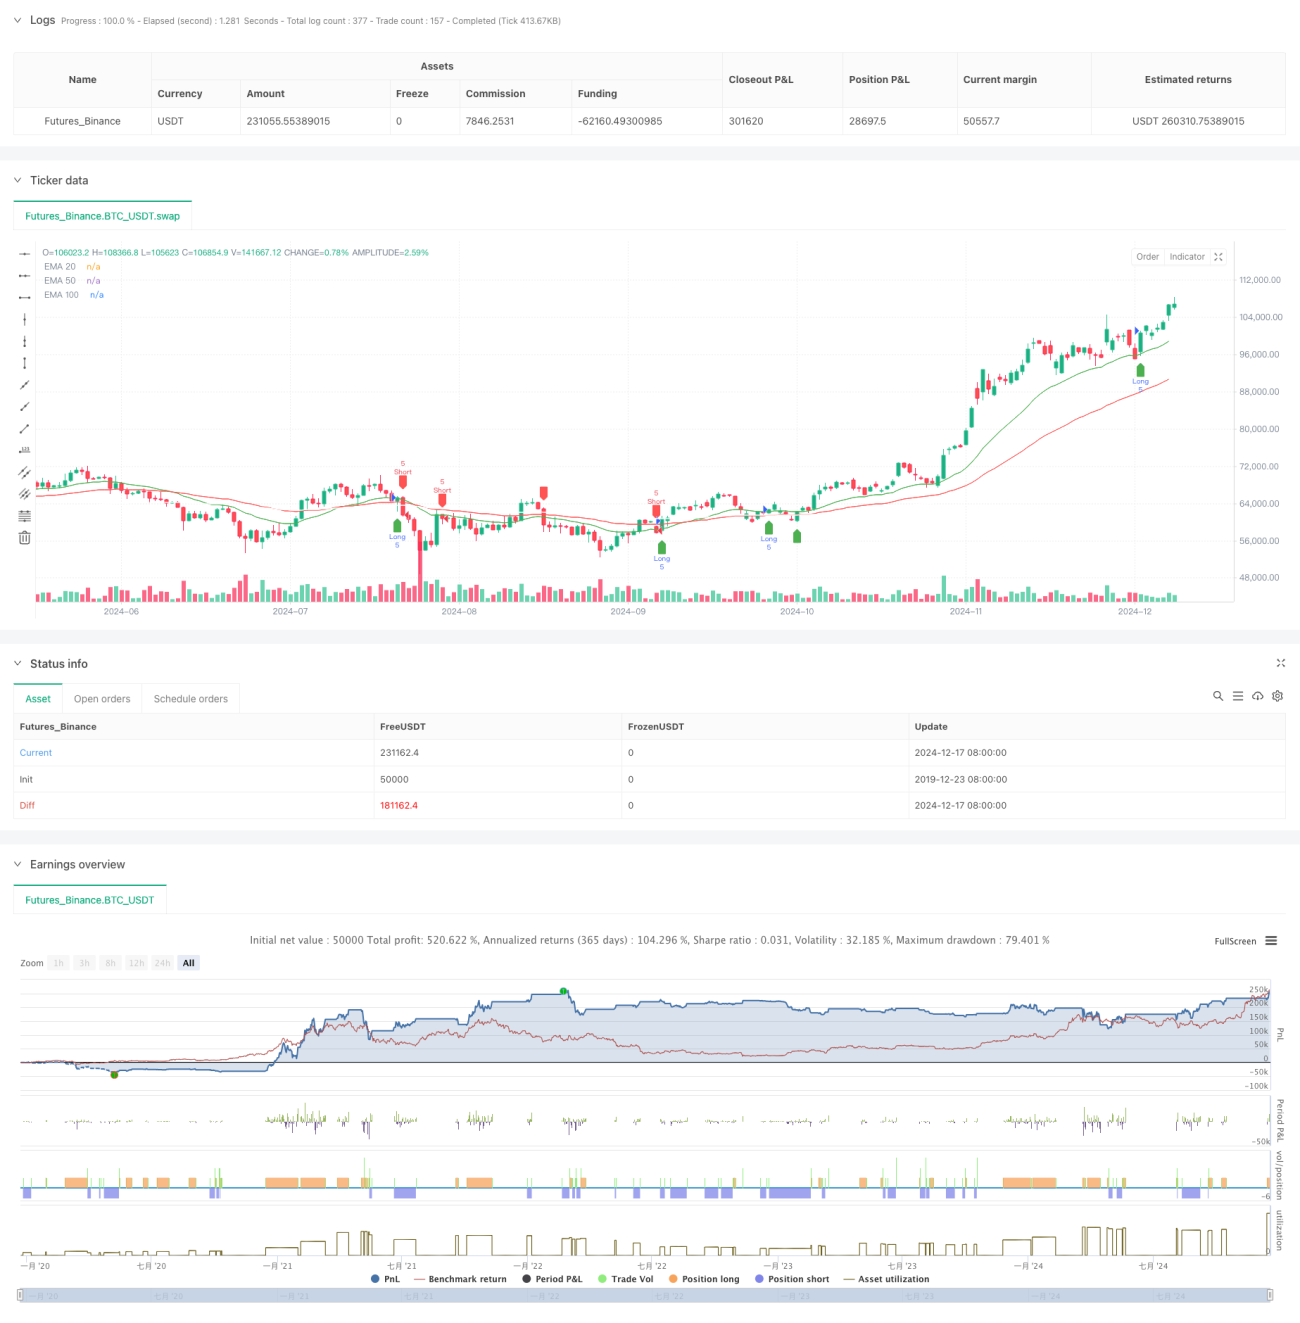
이 전략은 다중 지수 이동 평균 (EMA) 과 실제 변동의 폭 (ATR) 을 기반으로 한 트렌드 추적 거래 시스템이다. 이 전략은 20주기, 50주기 및 100주기 3개의 EMA를 협동적으로 조합하여 시장의 트렌드를 포착하고 ATR을 사용하여 역동적인 위험 관리 및 수익 목표를 설정한다. 이 방법은 거래의 체계성을 보장하면서 위험의 역동적인 통제를 실현한다.
전략 원칙
이 전략의 핵심 논리는 가격과 다중 EMA 사이의 상호관계에 기초하고 있습니다. 구체적으로:
- 입력 신호는 가격과 20주기 EMA의 교차를 기반으로 하며, 50주기 EMA를 트렌드 필터로 사용한다.
- 다중 입점 조건: 가격이 20주기 EMA를 착용하고 50주기 EMA 위에 위치한다
- 공허 입시 조건: 가격이 20주기 EMA를 통과하고 50주기 EMA 아래에 있다
- 스톱로스 설정: 14주기 ATR의 동적 계산에 기초하여 스톱로스 지점이 시장의 변동에 적응할 수 있도록 보장한다
- 수익 목표: 1.5배의 위험과 수익률을 적용합니다. 즉, 수익 목표는 손실의 1.5배입니다.
전략적 이점
- 다중 시간 주기 검증: 20/50/100 트리플 EMA의 조합을 통해 가짜 신호를 효과적으로 감소시킨다
- 다이내믹 리스크 관리: ATR 기반의 스톱 로즈 설정으로 리스크 관리가 더 시장에 적합합니다.
- 명확한 리스크/이익 비율: 장기적으로 안정적인 수익을 위해 리스크/이익 비율을 1.5배로 고정
- 트렌드 추적과 진동 파악: 큰 트렌드를 파악하면서도 단기 파동 기회를 놓치지 않는다.
- 시각화 거래 신호: 전략은 거래자가 이해하기 쉽고 실행하기 쉬운 명확한 그래픽 인터페이스를 제공합니다.
전략적 위험
- 위기 시장 위험: 수평 정리 단계에서 빈번한 가짜 브레이크 신호가 발생할 수 있습니다.
- 슬라이드 포인트 위험: 시장이 급격히 변동할 때 실제 거래 가격이 신호 가격과 오차가 있을 수 있다.
- 트렌드 리버스 위험: 강한 트렌드가 급격하게 변하면 큰 손실이 발생할 수 있습니다.
- 매개변수 최적화 위험: 과도한 최적화로 인해 실제 거래에서 해당 전략의 성과가 저하될 수 있습니다.
전략 최적화 방향
- 거래량 지표 도입: 거래량으로 가격 돌파의 유효성을 확인할 수 있다.
- 트렌드 강도 필터를 추가: 진입 품질을 높이기 위해 ADX와 같은 트렌드 강도 지표를 도입하는 것을 고려하십시오.
- 최적화된 스톱: 수익을 더 잘 고정하기 위해 스톱 추적을 고려할 수 있습니다.
- 시장 환경 분류: 다른 시장 환경에 따라 조정 전략 매개 변수
- 변동성 필터 도입: 과도한 변동성 시장 환경에서의 거래 중단
요약하다
이 전략은 다중 평평선 시스템과 ATR 동적 풍선 제어의 결합을 통해 트렌드 추적과 파급 동작 특성을 겸비한 거래 시스템을 구축한다. 전략의 장점은 체계성이 강하고 위험 제어 가능하다는 데 있다. 그러나 실제 응용에서는 시장 환경에 대한 적응성에 주의를 기울이고 실제 상황에 따라 타겟팅 최적화가 필요합니다. 합리적인 매개 변수 설정과 엄격한 위험 통제를 통해 이 전략은 대부분의 시장 환경에서 안정적인 거래 효과를 얻을 것으로 예상된다.
Source
Pine
Strategy parameters
Related strategies
Comment
All comments (0)
No data
- 1